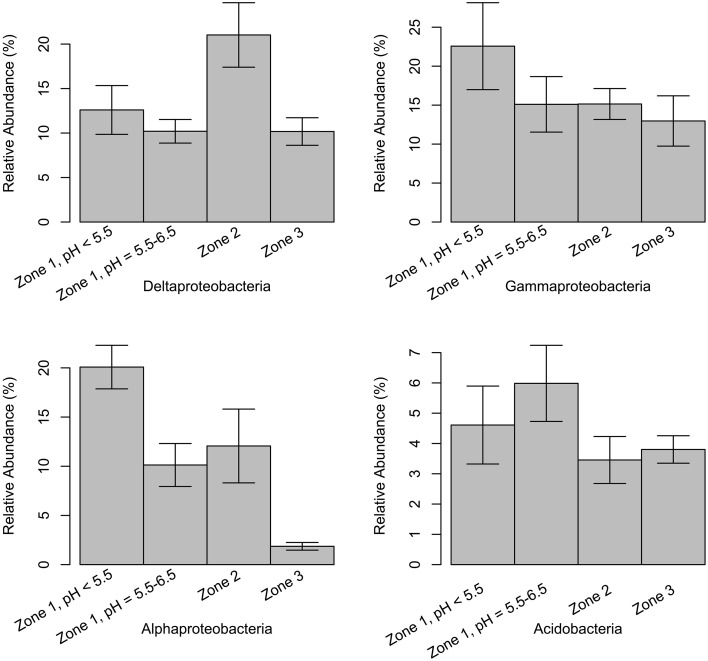
Figure 6.
Relative abundance of classes delta-, gamma-, alpha-proteobacteria, and Acidobacteria from Zone 1 to Zone 3. Samples in Zone 1 are separated into two parts based on the pH values and structure similarity (Figure 3A). The error bars show the 95% higher and lower confidence intervals around mean values.

