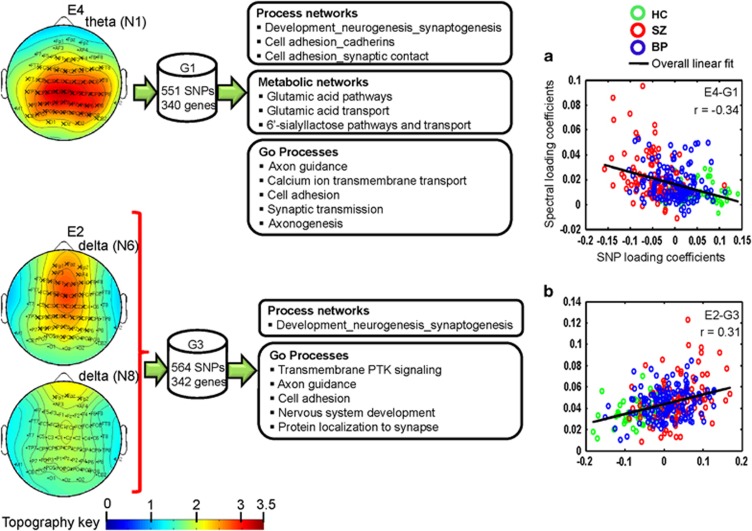
Figure 2.
Spatial maps of eyes-open EEG frequency activity and associated genetic networks derived from parallel independent component analysis. (a) E4-G1 component pair, (b) E2-G3 component pair. E4 comprised posterior theta activity. E2 comprised two anterior delta activities. The spatial weights were converted to Z-scores. ‘X' indicates those electrodes for which the weights exceeded threshold |Z|=2. Biological pathways and process networks associated with each gene network from enrichment analysis are also displayed. The scatter plot of loading coefficients for the frequency-specific spatial components and genetic networks is also shown. BP, bipolar disorder; EEG, electroencephalogram; HC, healthy control; SNP, single-nucleotide polymorphism; SZ, schizophrenia.

