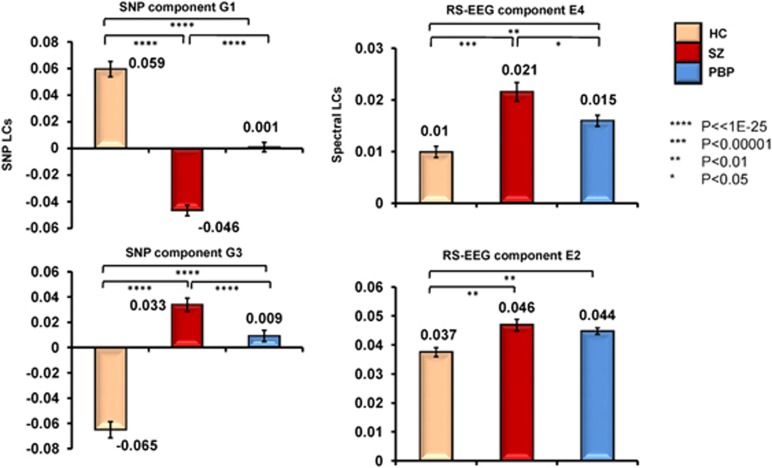
Figure 3.
Mean loading coefficients (LC) for spatio-spectral EEG components and gene networks for schizophrenia (SZ) (n=105), psychotic bipolar probands (PBP; n=145) and healthy controls (HC; n=56). EEG LC represents each subject's contribution to the spatial weights associated with the delta and theta frequency components. Genetic LC represents each subject's contribution to the genetic network. E4 is posterior theta activity. E2 included two anterior delta components. Error bars represent standard deviation. Post hoc comparisons included pairwise t-tests between HCs and SZ and PBP probands. EEG, electroencephalogram; SNP, single-nucleotide polymorphism.

