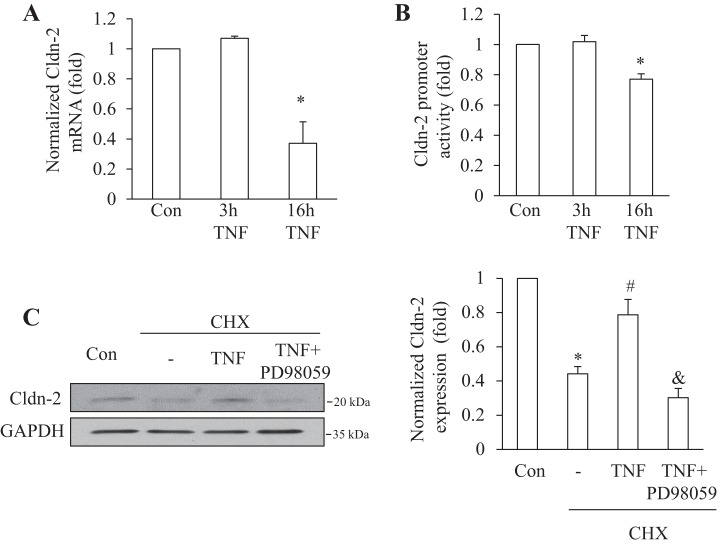
Fig. 4.
Differential role of altered Cldn-2 transcription in the early and late TNF-α effects. A: LLC-PK1 cells were treated for the indicated times with 10 ng/ml TNF-α. RNA extraction, cDNA synthesis, and SYBR green based real-time PCR to determine Cldn-2 and GAPDH levels were performed as described under materials and methods. Data are means ± SE (n = 4). *P < 0.05 vs. control. B: LLC-PK1 cells were transfected with a firefly luciferase-coupled Cldn-2 promoter along with pRL-TK (Renilla luciferase, internal control). Twenty-four hours posttransfection cells were treated with 10 ng/ml TNF-α for 6 or 16 h. Luciferase activities were determined using the Dual Luciferase assay kit and normalized by dividing the Firefly luciferase activity with the Renilla luciferase activity. In each experiment mean from the three parallel measurements was calculated and values of treated samples were expressed as fold change from control taken as 1. The graph shows means ± SE (n = 4). *P < 0.05 vs. control. C: LLC-PK1 cells were treated with 100 μM cycloheximide (CHX) with or without 20 ng/ml TNF-α and 20 μM PD98059, as indicated, for 1 h. Cldn-2 levels were detected and quantified as in Fig 1. The graph shows means ± SE (n = 3). *P < 0.01 vs. control; #P < 0.01 vs. CHX treatment; &P < 0.01 vs. CHX + TNF treatment group.

