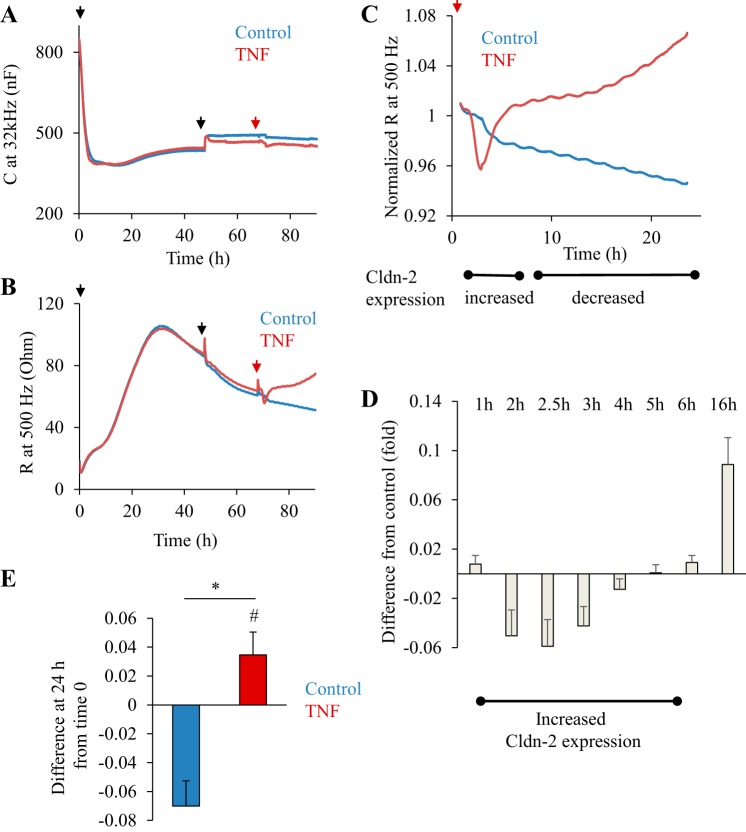
Fig. 6.
A: transepithelial resistance (TER) measurements in LLC-PK1 cells during the development of a confluent layer. TER of LLC-PK1 cells grown on filters was followed using electric cell-substrate impedance sensing (ECIS). At the beginning of each measurement filters with medium alone were placed in the ECIS filter holder. Capicitance (C) and resistance (R) were monitored for 15 min using the frequency scan mode to establish the R values of the empty filters. Next, the measurement was paused, and LLC-PK1 cells (1.5 × 10⁵ cells/filter) were plated on the filter (1st black arrow), and then the measurement was restarted. A shows C measured at 32 kHz, and B shows the corresponding R at 500 Hz. Note that at 24 h C reached a minimum, indicating confluence. At 48 h, the medium was changed (2nd black arrow). After 72 h, 20 μl medium alone (control, blue curve) or medium containing TNF-α (20 ng/ml final concentration, red curve) was added (second arrow). The curves are the average of 2 parallel measurements and are representatives of n = 6 independent experiments. C and D: biphasic effect of TNF-a on TER. The part of the curves in B following TNF-α addition is shown (the artifact caused by the addition was removed from the curve). The data were normalized to the last point before addition of TNF-α taken as 1. The x-axis shows time after TNF-α addition. The timing of Cldn-2 level changes induced by TNF-α is shown under the graph. D: differences in TER between control and TNF-α-treated cells were calculated using the normalized curves (see materials and methods). Graph shows means ± SE (n = 6 independent measurements performed in duplicates). E: change in TER induced by 24-h TNF-α treatment. The difference between the last point before treatment (taken as 1) and the normalized TER value at 24 h after treatment was determined in n = 6 independent experiments performed in duplicates. The positive value (TNF treatment, red column) indicates an increase in TER, while the negative value (control, blue column) indicates decrease. *P < 0.01 vs. control; #P < 0.05 vs. 0 (one-tailed t-test).

