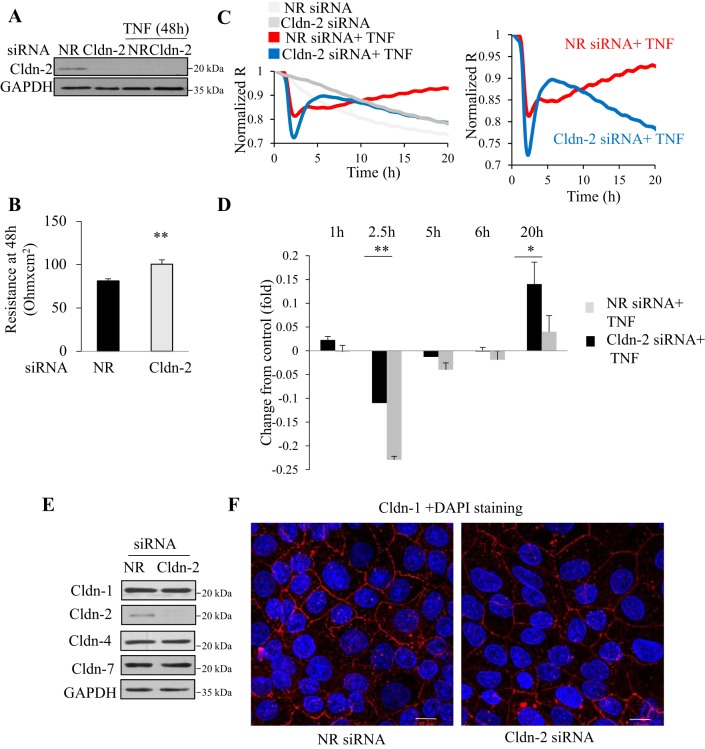
Fig. 7.
Effect of Cldn-2 downregulation on TNF-α-induced TER changes. A–D: LLC-PK1 cells were transfected with NR or Cldn-2-specific siRNA. Twenty four hours later the cells were trypsinized, and seeded on Corning permeable filters that were placed in the ECIS filter adapter, as in Fig 6. R was continuously measured at 500 Hz. A: effective and sustained downregulation of Cldn-2. At the end of the ECIS measurement (5 days posttransfection; 2 days after TNF addition), cells were lysed and Cldn-2 and GAPDH were detected by Western blotting. The blot is representative of n = 3 independent experiments. B: Cldn-2 silencing elevated basal TER. The graph shows R values at 48 h. R of the empty filter was subtracted. Graph shows means ± SE (n = 6 obtained in 3 independent measurements) **P < 0.01 vs. control. C and D: effect of TNF-α on TER in cells transfected with control and Cldn-2 siRNA. Cells were transfected with control (black curve) or Cldn-2 specific siRNA (grey). ECIS was performed as in Fig 6. C: at 48 h after seeding the cells 20 ng/ml TNF-α was added (taken as time 0). The curves are averages of 2 parallel measurements in a typical experiment and are representatives of n = 6 independent experiments. The values were normalized as in Fig 6. The left shows the full measurement. For easier comparison the 2 curves with TNF addition are also shown separately at right. D: differences in TER between cells transfected with NR siRNA and control siRNA were calculated as in Fig 6. The times indicate the time after TNF-α treatment. The graph shows means ± SE (n = 6 from 3 independent experiments). *P < 0.05; **P < 0.01 vs. control. E and F: Cldn-2 downregulation does not affect expression of other claudins or cell polarization. LLC-PK1 cells were transfected with NR or Cldn-2 specific siRNA. In E, expression of Cldn-1, -2, -4, and -7 was detected by Western blotting as in Fig 1. In F, Cldn-1 was stained with an antibody from Invitrogen and visualized with a Cy3-labeled anti-rabbit secondary antibody. This claudin was selected, since it is a “housekeeping claudin” the presence of which indicates polarization and intact TJs. The nuclei were stained using DAPI. Images were captured as in Fig 3. Maximum Intensity Projections are shown. The size bar in the right bottom corner = 10 μm. The images are representatives of n = 3 independent experiments.

