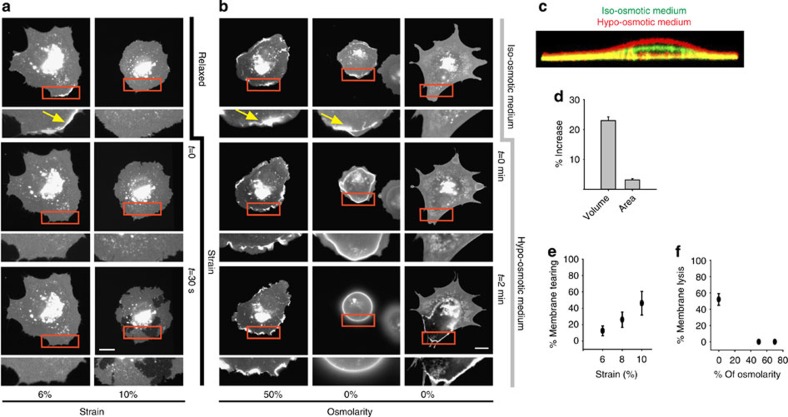
Figure 1. Membrane response to stretch and osmotic changes.
(a) Cells transfected with pEYFP-mem before (top panel) and after (middle and bottom panels) applying different magnitudes of constant stretch. Yellow arrow indicates a membrane ruffle flattened by stretch. (b) Cells transfected with pEYFP-mem before and after reducing medium osmolarity to either 50 or 0% of original medium. Cells submitted to 0% osmolarity (de-ionized water) for 3 min sometimes rounded and flattened membrane ruffles (middle panel) and sometimes underwent membrane lysis (right panel). Yellow arrows indicate membrane ruffles, which either remain or flatten after applying 50 or 0% hypo-osmotic medium, respectively. (c) Confocal slice showing a cell before (green) and after (red) application of medium with 50% osmolarity for 3 min. (d) Corresponding quantification of the increase in cell volume and required membrane area (n= 5 cells). (e) % of cells showing membrane tearing after 3 min of constant stretch application (n=70 cells). (f) % of cells showing membrane lysis after 3 min of application of medium with different osmolarity (n=50 cells). Scale bars, 20 μm. Error bars are mean±s.e.m.

