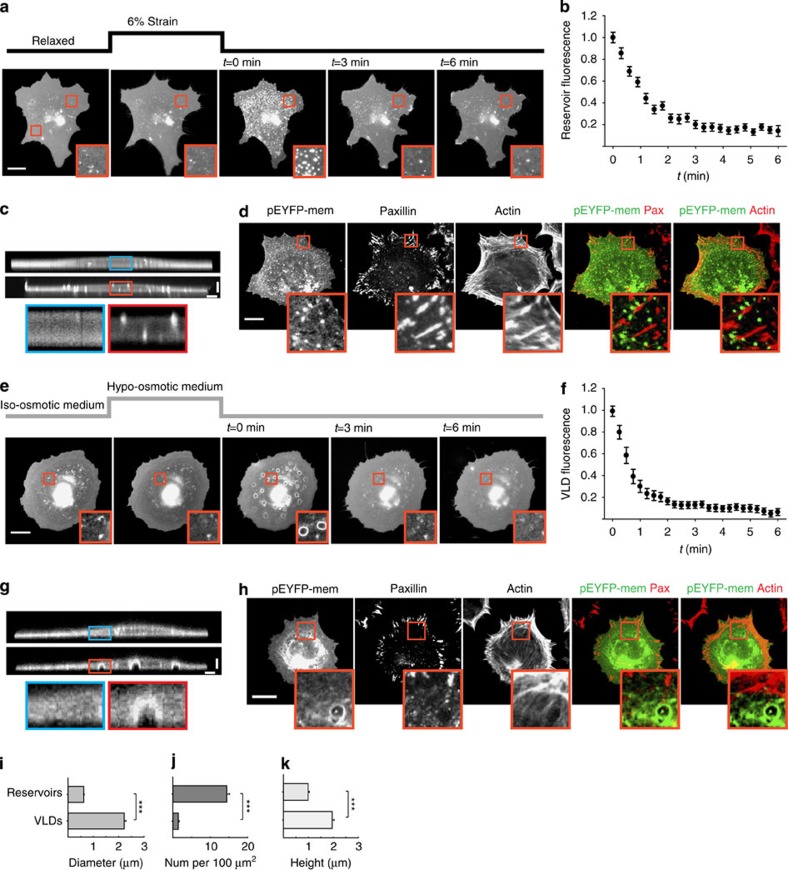
Figure 2. Cell membranes use different strategies to readapt to normal surface and volume.
(a) pEYFP-mem-transfected cells before, during and after constant stretch application during 3 min. (b) Quantification of reservoir fluorescence after stretch release (1: initial fluorescence, 0: background). n=100 reservoirs from 10 cells. (c) Confocal vertical slice from a pEYFP-mem-transfected cell before (top) and after (bottom) application of 6% stretch for 3 min. (d) Staining images of cells fixed immediately after stretch release showing the membrane (pEYFP-mem transfection), paxillin and actin. Merged co-localization images are shown to the right. (e) pEYFP-mem-transfected cells before, during and after application of 50% hypo-osmotic medium during 3 min. (f) Quantification of VLD fluorescence after re-application of iso-osmotic medium (1: initial fluorescence, 0: background). n=100 VLDs from 10 cells. (g) Confocal images of a pEYFP-mem-transfected cell before (top) and after (bottom) application of 50% hypo-osmotic medium for 3 min. (h) Staining images of cells fixed immediately after re-application of iso-osmotic medium showing the membrane (pEYFP-mem transfection), paxillin and actin. Merged co-localization images are shown to the right. (i) Quantification of mean diameter of structures formed after stretch release (reservoirs) and re-application of iso-osmotic medium (VLDs). n=250/100 structures from 8/10 cells. (j) Quantification of mean density of structures formed after stretch release (reservoirs) and re-application of iso-osmotic medium (VLDs). n=30/50 regions from 5/8 cells. (k) Quantification of mean height of structures formed after stretch release (reservoirs) and re-application of iso-osmotic medium (VLDs). n=80/50 structures from 6/4 cells (***P<0.001, two-tailed Student's t-test). We note that reservoir heights are close to the axial resolution of our confocal microscope (0.9 μm) and thus represent upper estimates rather than accurate measurements. Scale bars are 5 μm in c,g and 20 μm in d,h. In all cases, zoomed insets (10 × 6 μm2 in c,g and 10 × 10 μm2 in d,h) show a magnification of the area marked in the main image. Error bars are mean±s.e.m.

