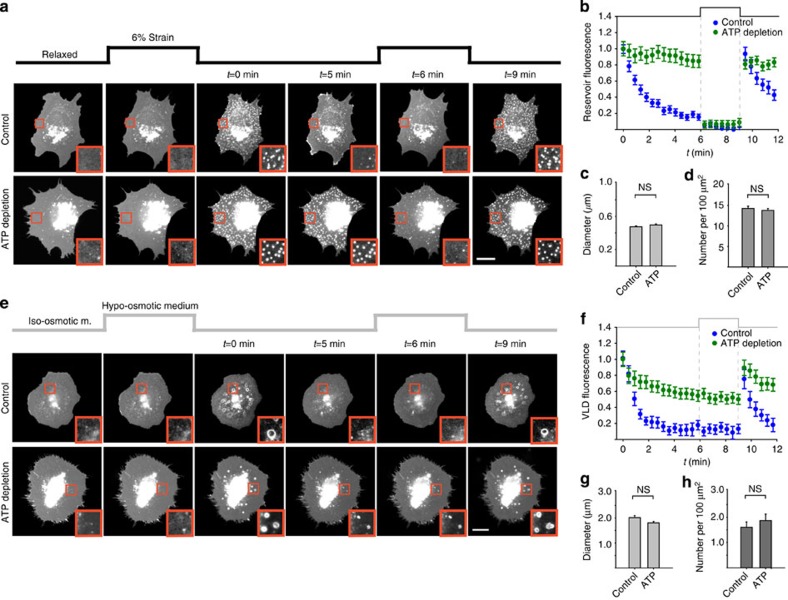
Figure 5. Membrane mechanical adaptation is a passive process followed by active recovery.
(a) Examples of control and ATP-depleted pEYFP-mem-transfected cells before, during and after application of two 3-min constant stretch pulses. (b) Quantification of reservoir fluorescence after release of first stretch pulse and during application and release of the second pulse (n=50/70 reservoirs from 5/5 cells). The effect of ATP depletion was significant (P<0.001). (c) Quantification of reservoir size in control and ATP-depleted cells (n=150/200 reservoirs from 3/4 cells). No significant differences were observed, two-tailed Student's t-test. (d) Quantification of reservoir density in control and ATP-depleted cells (n=50/50 regions from 5/5 cells). No significant differences were observed. (e) Examples of control and ATP-depleted pEYFP-mem-transfected cells before, during and after application of 50% hypo-osmotic medium in two 3-min pulses. (f) Quantification of VLD fluorescence after the first re-application of iso-osmotic medium and during application and release of the second pulse (n=35/40 VLDs from 3/3 cells). The effect of ATP depletion was significant (P<0.001, two-tailed Student's t-test). (g) Quantification of VLD size in control and ATP-depleted cells (n=30/35 VLDs from 3/3 cells). No significant differences were observed. (h) Quantification of VLD density in control and ATP-depleted cells (n=20/25 regions from 3/3 cells). No significant differences were observed. Scale bars, 20 μm. Insets show zoomed views (10 × 10 μm2) of membrane structures.

