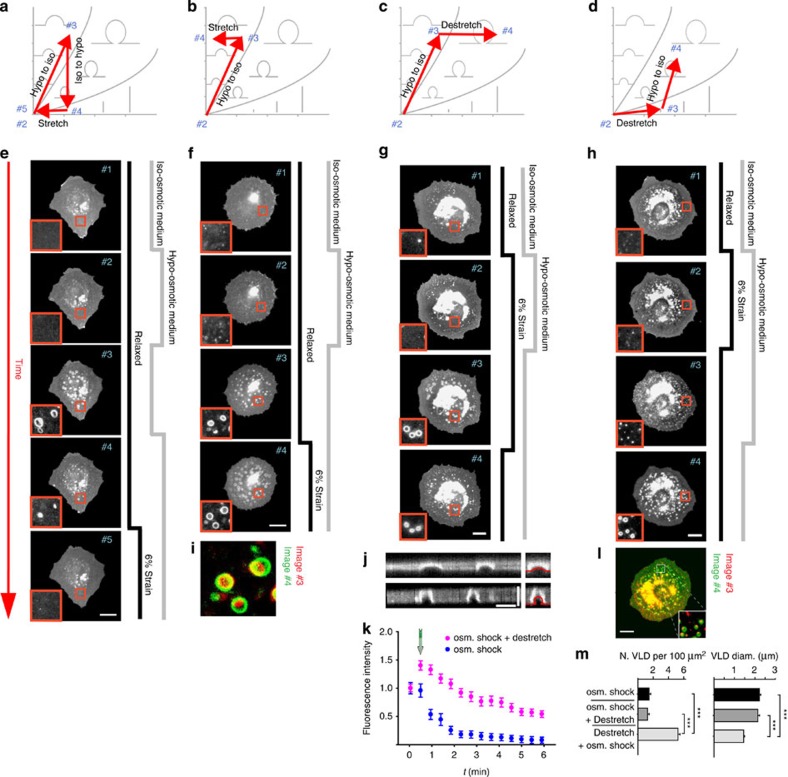
Figure 7. Membrane remodelling can be described through pathways along the surface/volume phase diagram.
(a–d) Different pathways tested in the phase diagram by applying stretch and hypo-osmotic shocks (red arrows, numbers refer to the corresponding image in the panel below). (e–h) Corresponding response of pEYFP-mem-transfected cells after applying stretch and osmotic shocks as indicated to follow the pathways. Time flows from top to bottom. In all cases, the first application of stretch/hypo-osmotic shock (second row of cells) lasted 3 min. Subsequent steps were carried out as quickly as possible to evaluate membrane response before cells had time to actively eliminate structures. (i) In cells submitted to hypo-osmotic shock, co-localization of membrane structures formed after first restoring iso-osmotic medium (red) and then applying stretch (green). (j) Confocal vertical slices showing VLD shape before (top) and after (bottom) stretch release. Zoomed image to the right shows the superimposed shape prediction from the theoretical model in red. (k) Quantification of VLD fluorescence for cells under hypo-osmotic medium after either restoring iso-osmotic medium (blue symbols) or restoring iso-osmotic medium and then releasing stretch application (pink symbols, arrow indicates moment of stretch release). N=100/50 structures from 10/5 cells. (l) In cells submitted to both hypo-osmotic shock and stretch, co-localization of membrane structures formed after first releasing stretch (red) and then restoring iso-osmotic medium (green). (m) Quantification of VLD diameter (n=100/50/70 structures from 10/3/3 cells, ***P<0.001, analysis of variance (ANOVA)) and density (n=50/30/30 regions from 8/3/3 cells, ***P<0.001, ANOVA) in cells submitted only to osmotic shocks or also to de-stretch (stretch release) before or after restoring iso-osmolarity). Scale bars are 5 μm in j and 20 μm elsewhere. Insets show zoomed views (10 × 10 μm2) of membrane structures. Error bars are mean±s.e.m.

