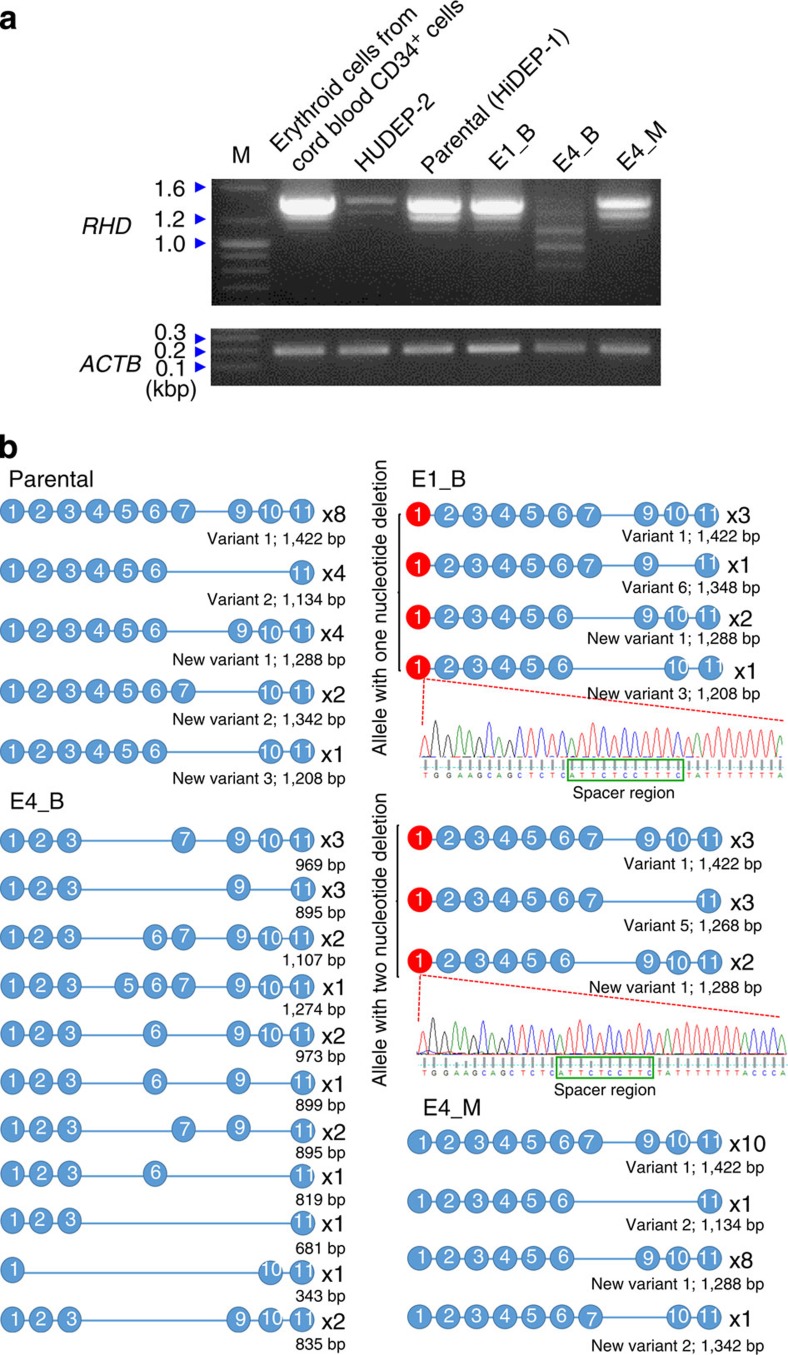
Figure 4. RHD mRNA in the mutated clones.
RT–PCR was performed to detect RHD mRNA in each clone and the amplicons were subjected to electrophoresis (a) and sequencing (b). (a) Representative pictures of electrophoresis. ACTB was used as control. The sizes of marker (M) bands are shown on the left (kbp, kilobase pairs). (b) Schematic representation of RHD mRNA sequences. The number of occurrences is shown on the right of each transcript. Blue and red circles indicate normal and mutated exons, respectively. For some amplicons, the sequence and sequencing chromatogram are shown (spacer regions are indicated with green boxes).

