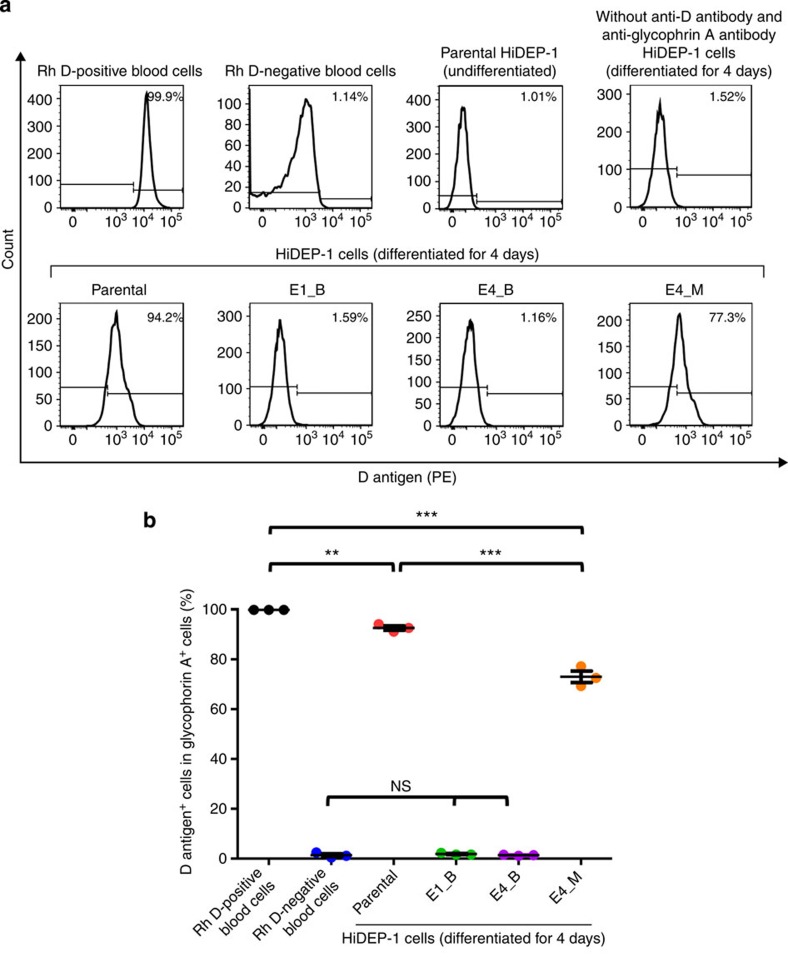
Figure 5. Flow cytometric analysis of D antigen expression in mutated cells.
Parental and RHD-mutated (biallelic, E1_B, E4_B; monoallelic, E4_M) HiDEP-1 cells were induced for differentiation for 4 days and subjected to flow cytometry. D antigen expression was determined in glycophorin A+ cells. (a) Representative histograms. (b) The percentage of D antigen-positive cells in the population of glycophorin A-positive cells. ANOVA followed with Bonferroni's multiple comparison was performed (***P<0.001, **P<0.01, ns=not significant; n=3). Error bars represent the s.e.m.

