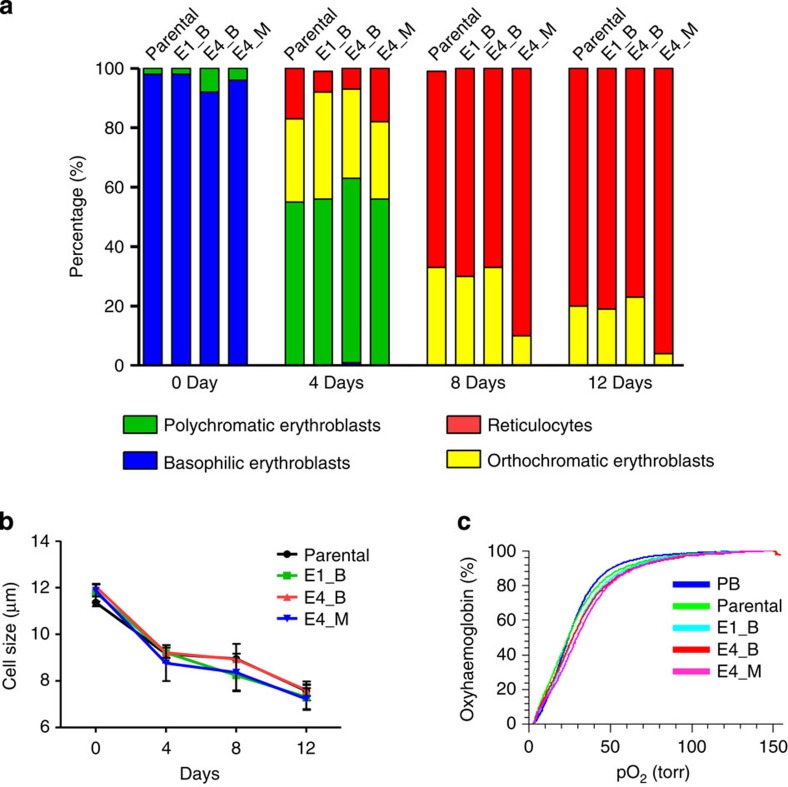
Figure 7. The RHD mutation does not affect the differentiation and function of HiDEP-1.
(a,b) At the indicated times after the induction of erythrocyte differentiation, differentiation of each HiDEP-1 cell line was quantified using microscopy after Wright–Giemsa staining. (a) Morphological analysis of differentiation. The sum of two independent experiments is shown. (b) Cell size during differentiation. ANOVA showed that the cell sizes were the same in the parental and RHD-mutant clones. Error bars represent the s.e.m. n=3. (c) Oxygen equilibrium curves of parental and RHD-mutant clones (E1_B, E4_B and E4_M). Human adult peripheral blood (PB) cells were used as the control.

