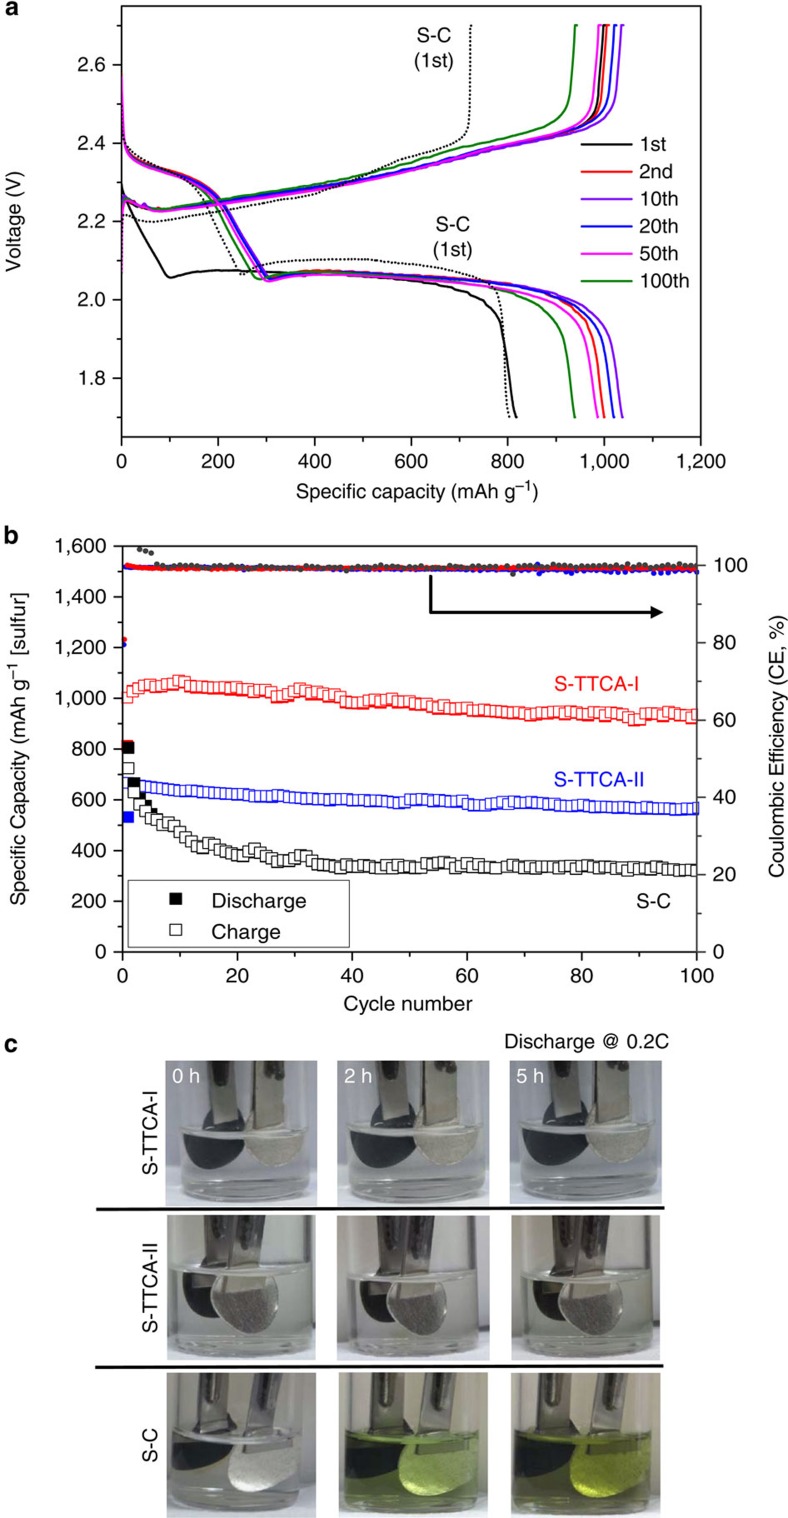
Figure 5. Battery performance of Li–S cells.
(a) Representative galvanostatic discharge/charge voltage profiles of the Li/S-TTCA-I cell, cycled between 1.7 and 2.7 V at 0.2 C at room temperature. The discharge/charge voltage profiles of the Li/S-C cell obtained at the first cycle are also shown as dashed lines. (b) The discharge/charge capacities and Coulombic efficiencies of the Li/S-TTCA-I and Li/S-TTCA-II cells, compared with those of conventional Li/S–C cells. (c) Photographs displaying the dissolution of polysulfide intermediates into electrolyte during discharge at 0.2 C for the Li/S–C beaker cell, contrary to the colourless electrolytes of the Li/S-TTCA cells.

