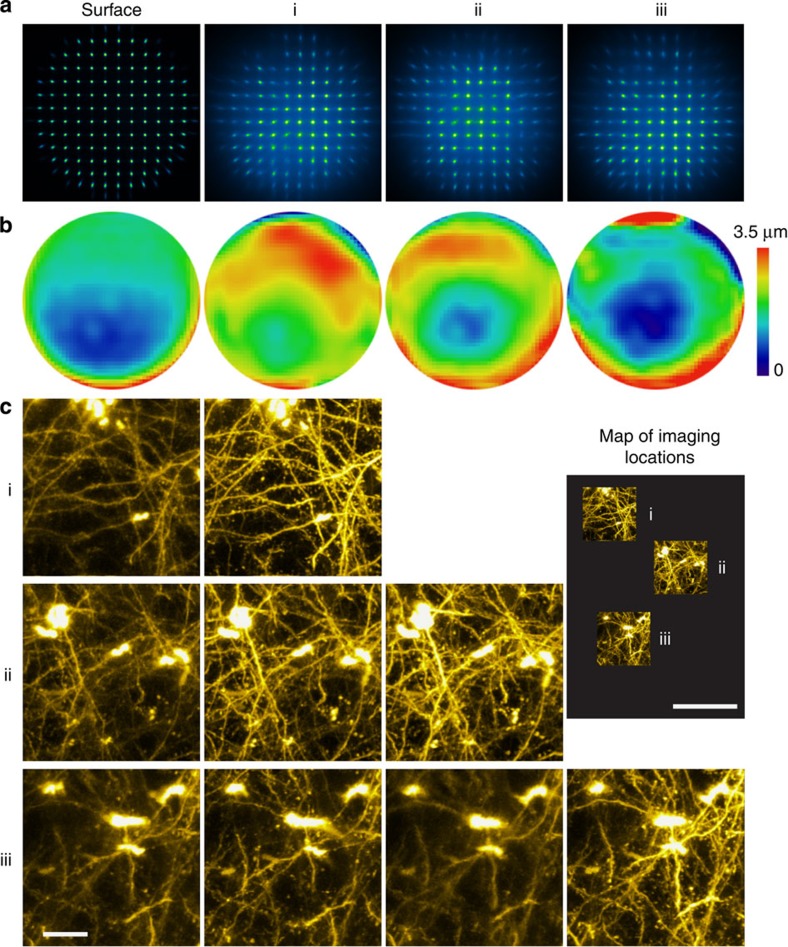
Figure 2. Exemplary spatial variation of sample-induced aberrations in the cortex of a living mouse.
(a) SH images and (b) their corresponding corrective wavefronts obtained at pia surface and three different regions (i, ii and iii) 400 μm below pia of a Thy1-YFPH mouse. (c) Images of regions i, ii and iii obtained with the corrective wavefronts in b, respectively. Scale bar, 20 μm. The inset (‘map of imaging locations') shows the relative positions of regions i, ii and iii. Scale bar, 100 μm (inset).

