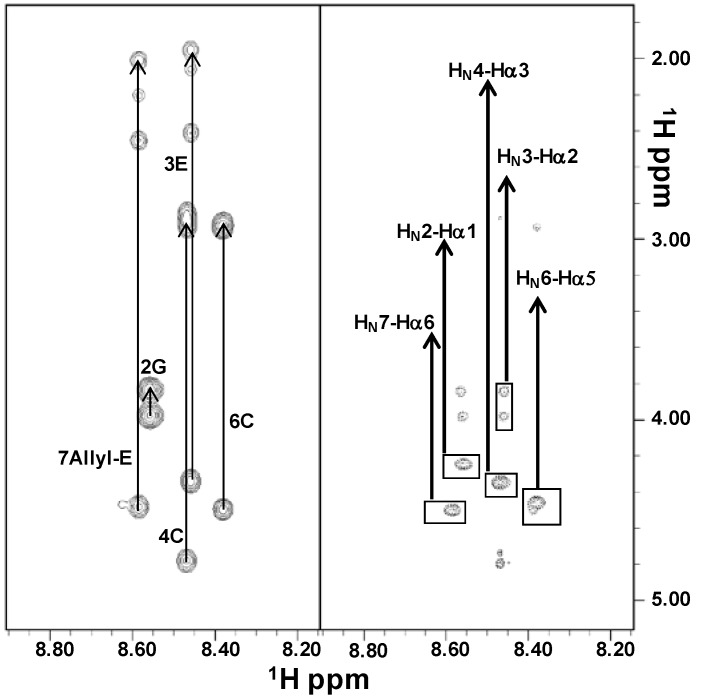
Figure 2.
Comparison of 2D [1H, 1H] TOCSY (left) and ROESY (right) spectra of PepE in H2O/D2O (90/10). The HN-aliphatic protons correlation regions are shown in each panel; spin system assignments are indicated in the left side. In the right panel, sequential ROE contacts are highlighted by rectangles and the corresponding assignments are indicated.

