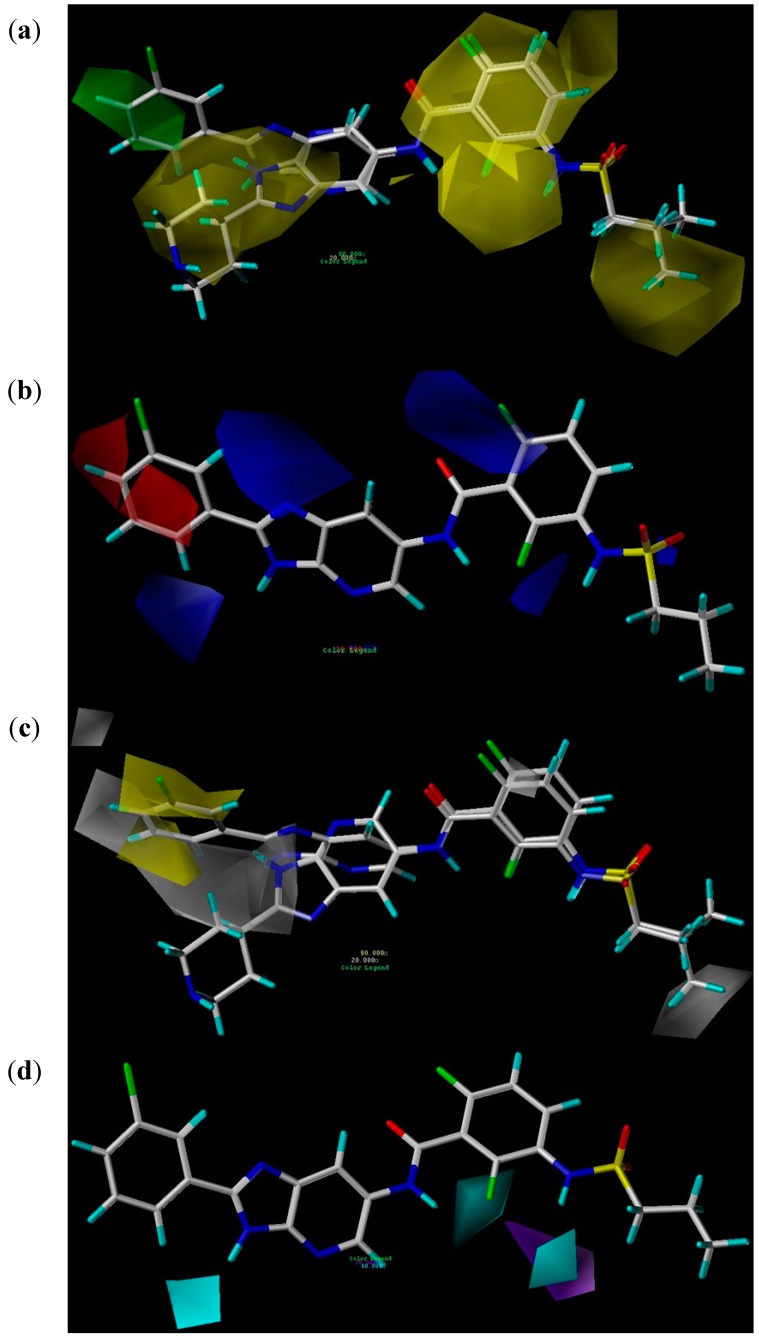
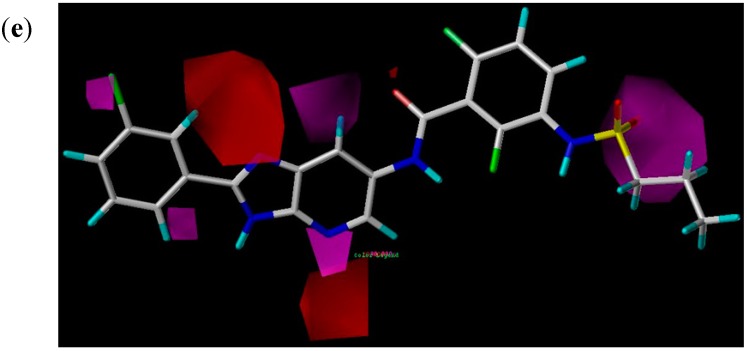
Figure 4.
(a) Steric contour maps in combination with compounds 18 and 10: green contours refer to sterically favored regions; yellow contours indicate sterically disfavored areas; (b) Electrostatic contour maps in combination with compound 18: blue contours refer to regions where positively charged substituents are favored; red contours indicate regions where negatively charged substituents are favored; (c) Hydrophobic contour maps in combination with compounds 18 and 10: yellow contours indicate regions where hydrophobic substituents are favored; white contours refer to regions where hydrophilic substituents are favored; (d) HBD contour map in combination with compound 18: cyan contours indicate HBD substituents in this region are favorable to activity; purple contours represent that HBD groups in this area are unfavorable; and (e) HBA contour maps in combination with compound 18: magenta contours show regions where HBA substituents are expected; red contours refer to areas where HBA substituents are unexpected.


