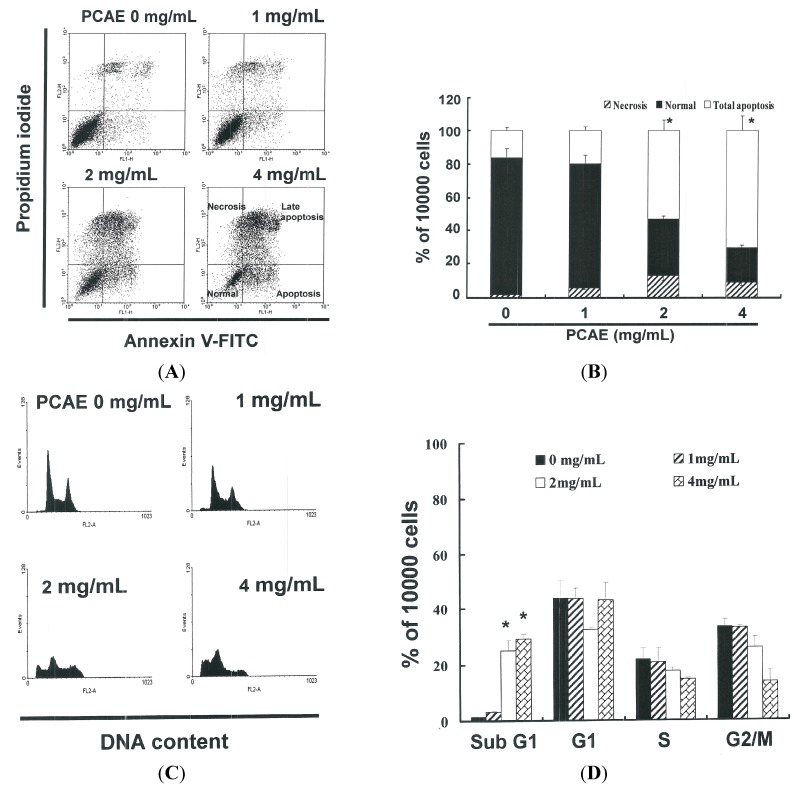
Figure 2.
(A) The influence of PCAE on apoptosis/necrosis in Ishikawa cells; (B) Total apoptosis in Ishikawa cells following incubation with PCAE for 4 h. (* p < 0.05 vs. PCAE 0 mg/mL control group). Influence of PCAE on cell cycle progression/distribution in Ishikawa cells: (C) cell cycle analysis of Ishikawa cells after being cultured with PCAE for 24 h; and (D) PCAE induced an increase in sub G1 (%). Cells underwent dual staining using propidium iodide to analyze DNA content, which was then quantified using flow cytometry. The * symbol in each group of bars indicates that the number of sub G1 cells in the PCAE treatment group was significantly greater than that of the control at a significance level of p < 0.05.

