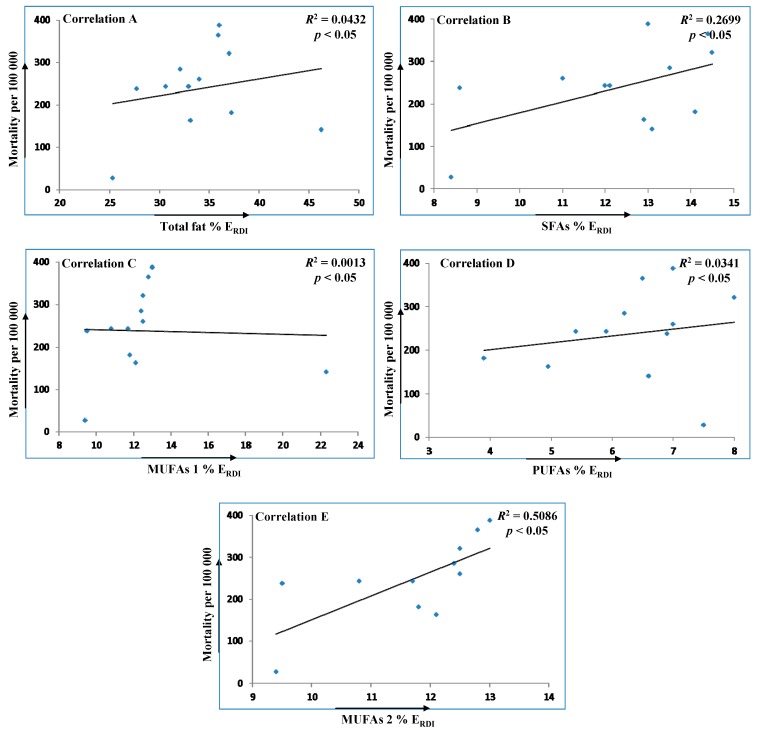
Figure 3.
Spearman’s correlations illustrating relationships between CHD and CVD mortality per 100,000 people and intakes (% ERDI) of total fat (A); SFAs (B); MUFAs 1 (C); PUFAs (D) and MUFAs 2 (E) in various countries. MUFAs 1 is correlation including all countries, whereas MUFAs 2 is created without data from Greece.

