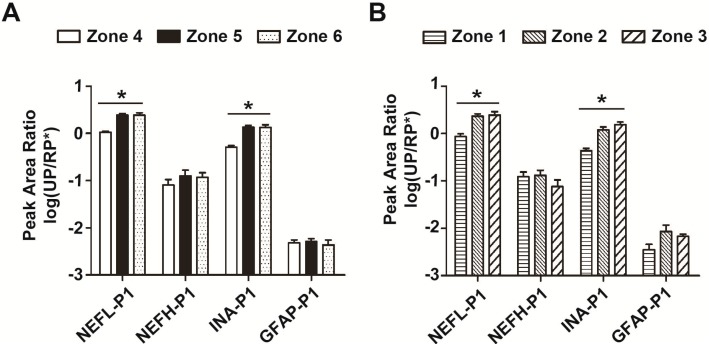
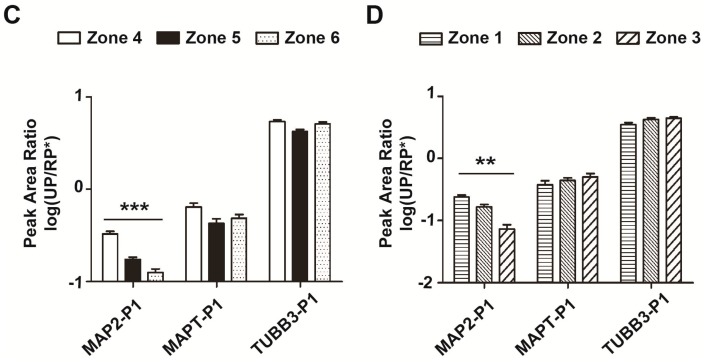
Figure 4.
Distribution of neurofilament and microtubule peptides/proteins in both intact and infarcted brain tissues. (A) Proteins in zones 4–6 of intact brain tissue were collected by LCM, 10 mm2 for each area, and then analyzed by a triple-quadrupole mass spectrometer. Four neurofilament proteins were verified and semi-quantified by LCM–LRP. Each protein was verified by 2–3 unique peptides and quantified by the peak area. The unique peptides with the greatest peak area are shown. Peak area ratios of unique peptides to RP* were calculated (UP/RP*) (n = 12); (B) Four neurofilament proteins in zones 1–3 of infarcted brain tissue were collected by LCM, and then the peak area ratios of 4 unique peptides to RP* were determined (n = 12); (C) There were 3 microtubule proteins from zones 4–6 of intact brain tissues verified and semi-quantified by LCM–LRP. Each protein was verified by 2–3 unique peptides and quantified by the peak area. The unique peptides with the greatest peak area are shown. Peak area ratios of unique peptides to RP* were calculated (UP/RP*) (n = 12); (D) Three microtubule proteins in zones 1–3 of infarcted brain tissue are collected by LCM, and then the peak area ratios of 3 unique peptides to RP* were determined (n = 12). Unique peptide 1 for neurofilament light polypeptide (NEFL-P1), FTVLTESAAK; unique peptide 1 for neurofilament heavy polypeptide (NEFH-P1), FAQEAEAAR; unique peptide 1 for α-internexin (INA-P1), AQLEEASSAR; unique peptide 1 for glial fibrillary acidic protein (GFAP-P1), ALAAELNQLR; unique peptide 1 for microtubule-associated protein 2 (MAP2-P1), GLSSVPEVAEVETTTK; unique peptide 1 for microtubule-associated protein tau (MAPT-P1), TPSLPTPPTR; unique peptide 1 for tubulin beta-3 chain (TUBB3-P1), YLTVATVFR. * p < 0.05; ** p < 0.01; *** p < 0.001.


