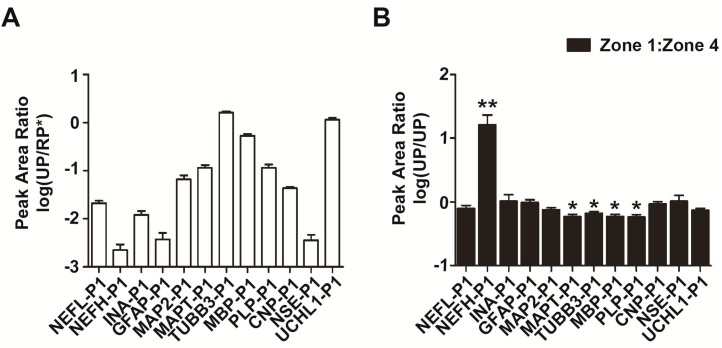
Figure 6.
Abundance and stability analysis of protein biomarker candidates by LCM–LRP. (A) Twelve protein biomarker candidates in brain tissue homogenates were verified and semi-quantified by triple-quadrupole mass spectrometry. The abundance of each protein was estimated by the peak area ratio of its corresponding unique peptide (n = 12); (B) Peak areas of 12 unique peptides in zone 1 were compared to those in zone 4 (1:4), and the relative peak area ratios (UP/UP) are shown (n = 12). * p < 0.05; ** p < 0.01.

