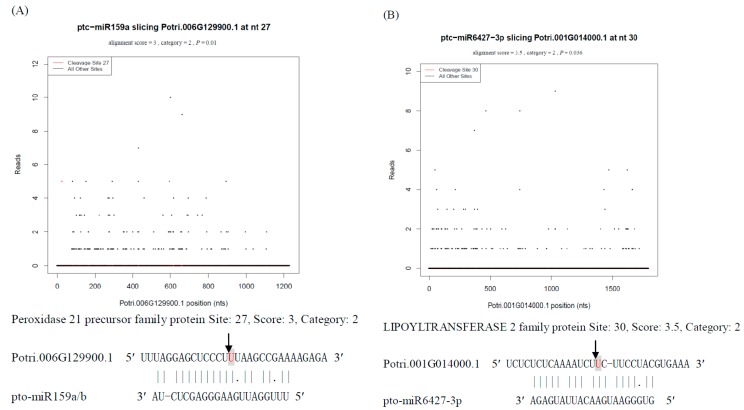
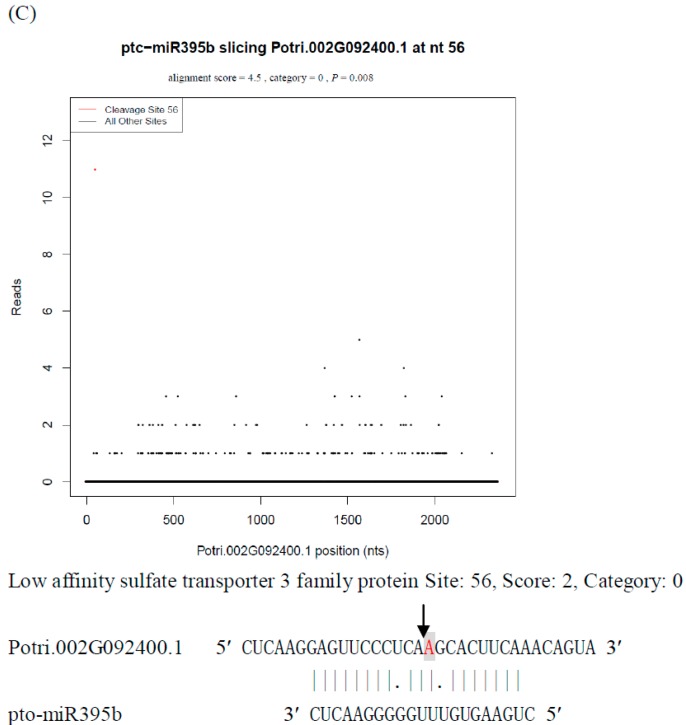
Figure 5.
Target plots (t-plots) for three N-responsive miRNA targets confirmed by degradome sequencing (A) ptm-miR159a; (B) pto-miR395b; (C) pto-miR6427-3p. Red dots indicate signatures consistent with miRNA-directed cleavage. The solid lines and dots in the miRNAmRNA alignments indicate matched RNA base pairs and GU mismatches, respectively. Below the t-plots, the cleavage sites are shown by the arrows and the cleaved bases are indicated by shaded letters.


