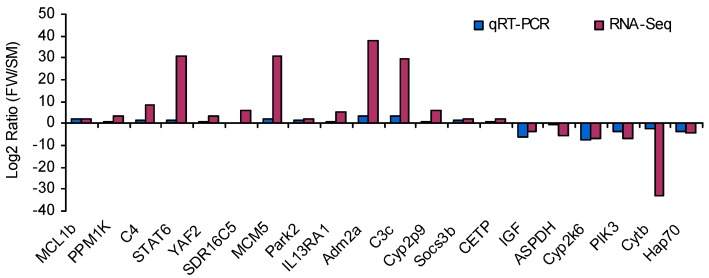
Figure 4.
DEGs validated by qRT-PCR. Comparison of RNA-Seq and qRT-PCR validation results. x-axis shows genes in three tissues validated in this study; y-axis shows the log2 ratio of expression in FW (freshwater) versus SM (spawning migration) Amur ide. MCL1b, myeloid cell leukemia sequence 1b; PPM1K, protein phosphatase 1K; C4, complement component 4; STAT6, signal transducer and activator of transcription 6, interleukin-4 induced; YAF2,YY1 associated factor 2; SDR16C5, short chain dehydrogenase/reductase family 16C, member 5b; MCM5, minichromosome maintenance deficient 5; Park2, Parkin 2; IL13RA1, interleukin 13 receptor, α 1; Adm2a, adrenomedullin 2a; C3c, complement component c3c; Cyp2p9, cytochrome P450, family 2, subfamily P, polypeptide 9; Socs3b, suppressor of cytokine signaling 3b; CETP, cholesteryl ester transfer protein, plasma; IGF, Insulin-like growth factor; ASPDH, aspartate dehydrogenase domain containing; Cyp2k6, cytochrome P450, family 2, subfamily K, polypeptide 6; PIK3, phosphoinositide-3-kinase, regulatory subunit 1 (p85 α); Cytb, cytochrome b, mitochondrial; Hap70, heat shock cognate 70 kD protein, tandem duplicate 3.

