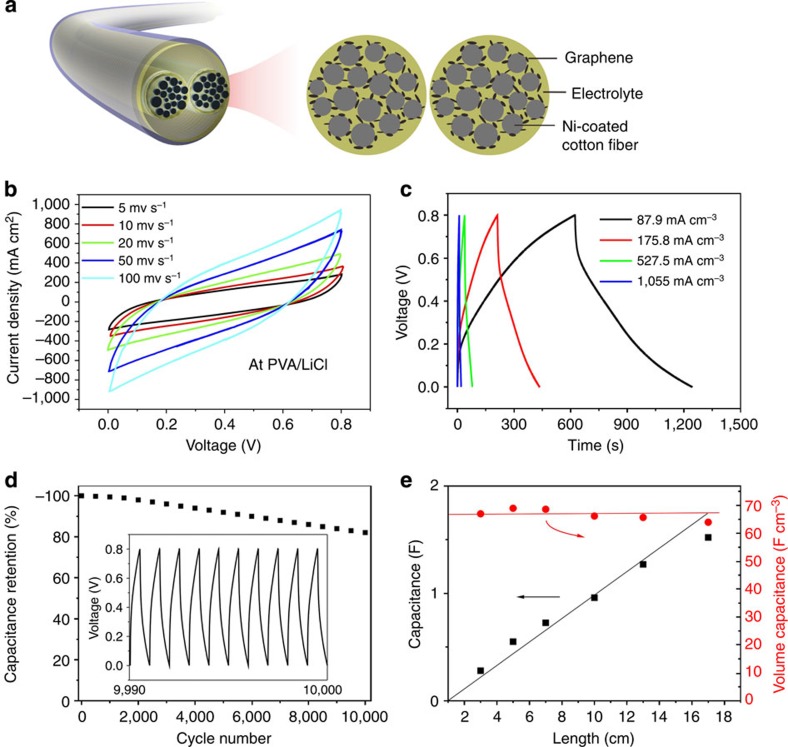
Figure 5. Performances of solid-state SC yarns.
(a) Schematic illustration of the structure of one SC yarn. (b) CV curves of the device at scan rates ranging from 5 to 100 mv s−1. (c) GCD curves of the device at different current densities. (d) Cycle life of the device. The inset is the GCD curve from the 9,990th to 10,000th cycle. (e) Device capacitance as a function of the device length.

