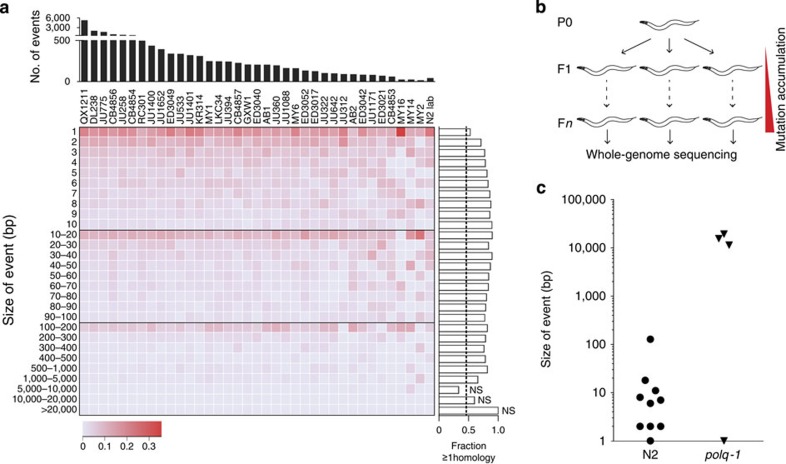
Figure 3. TMEJ is a driver of genomic diversification in C. elegans.
(a) A heat map representation of all genomic deletions events that were uniquely present in natural isolates of C. elegans, in which deletions are binned to size. The intensity of the colour reflects the fraction of deletions in each bin; the number of deletions for each strain is plotted above the heat map. The lane ‘N2 lab' represents deletions that accumulated in the Bristol N2 strains upon culturing in three different laboratories. For each size bin the fraction of microhomology ≥1 is plotted to the right of the heat map. The calculated ratio, as well as an empirically determined ratio, for the presence of microhomology ≥1 is 0.47 for a randomly distributed set of deletions in the C. elegans genome9, which is represented by a dashed line. All size bins display a statistically elevated level of microhomology (P<0.001, binomial test), except for deletions >5,000, which were rare (n=19): NS indicates no statistically significant difference to the expected ratio of 0.47. (b) Schematic illustration of the experimental setup reflecting small-scale evolution. Progeny animals (F1) from a single hermaphrodite (P0) are picked to separate plates to establish independent populations that were thus isogenic at the start of culturing. To establish bottlenecks and to carefully keep tract of the number of generations (n), a small number of progeny animals were transferred to new plates each generation. DNA was isolated from the progeny of a single animal (Fn) and sequenced by next-generation sequencing technology with a base coverage of ∼30 for each sample. (c) A dot plot representing all unique deletion events that were found in the genomes of wild-type (N2) and polq-1 mutant animals.

