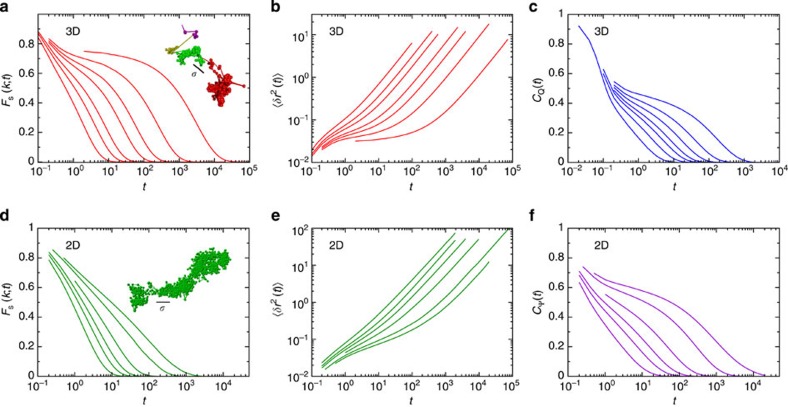
Figure 1. Structural relaxation in two and three dimensions.
(a) The self-intermediate scattering function Fs(k; t) for the 3D glass former for T=1.0, 0.8, 0.7, 0.6, 0.55, 0.5 and 0.45 listed from left to right. The mode-coupling temperature  . The inset shows a trajectory plot of one small particle at T=0.45 where the colour of the trajectory plot changes when the particle moves more than one large particle diameter σ (length of the black line) over a time of 0.1τα. (b) The mean square displacement 〈δr2(t)〉 for the 3D system showing the same temperatures as in a. (c) The bond-orientational correlation function CQ(t) for the 3D glass former showing the same temperatures as in a. (d) The self-intermediate scattering function Fs(k;t) for the 2D glass former for T=1.0, 0.8, 0.7, 0.6, 0.5 and 0.45 listed from left to right. The inset shows a trajectory plot of a small particle, and no sudden jumps are observed. (e) The mean square displacement 〈δr2(t)〉 for the 2D system showing the same temperatures as in d. (f) The bond-orientational correlation function CΨ(t) for the 2D glass former showing the same temperatures as in d. (a–f) Results for the Kob–Andersen binary mixtures.

