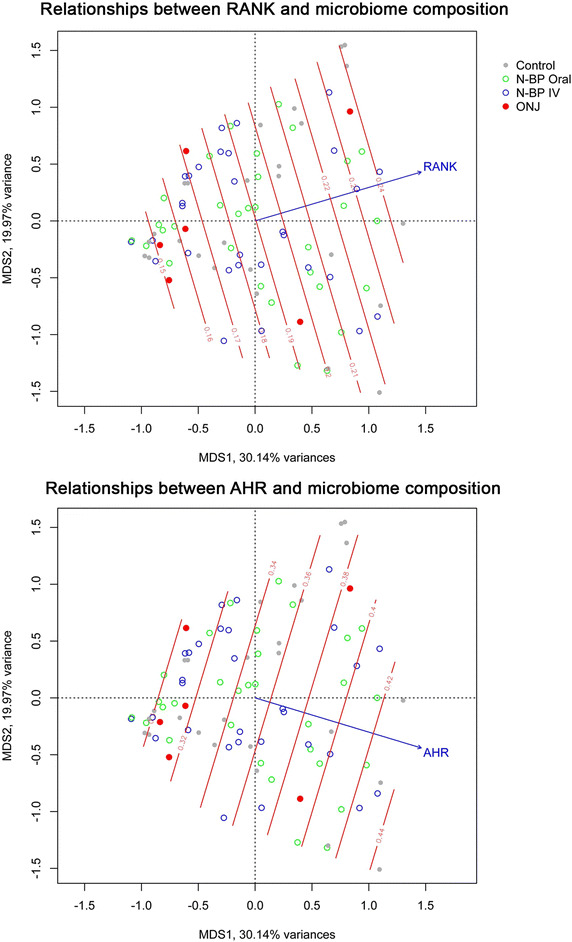
Figure 5.

Systemic gene expression levels of RANK and AHR explain part of the variation observed in the oral microbiome. Ordinations of all microbial communities are plotted using principal coordinates analysis (capscale) based on Bray-Curtis dissimilarities. The contour of RANK (upper panel) and AHR (lower panel) gene expression levels are average values calculated using a multi-dimensional linear model in odisurf, and arrows indicate the direction of increasing gene expression.
