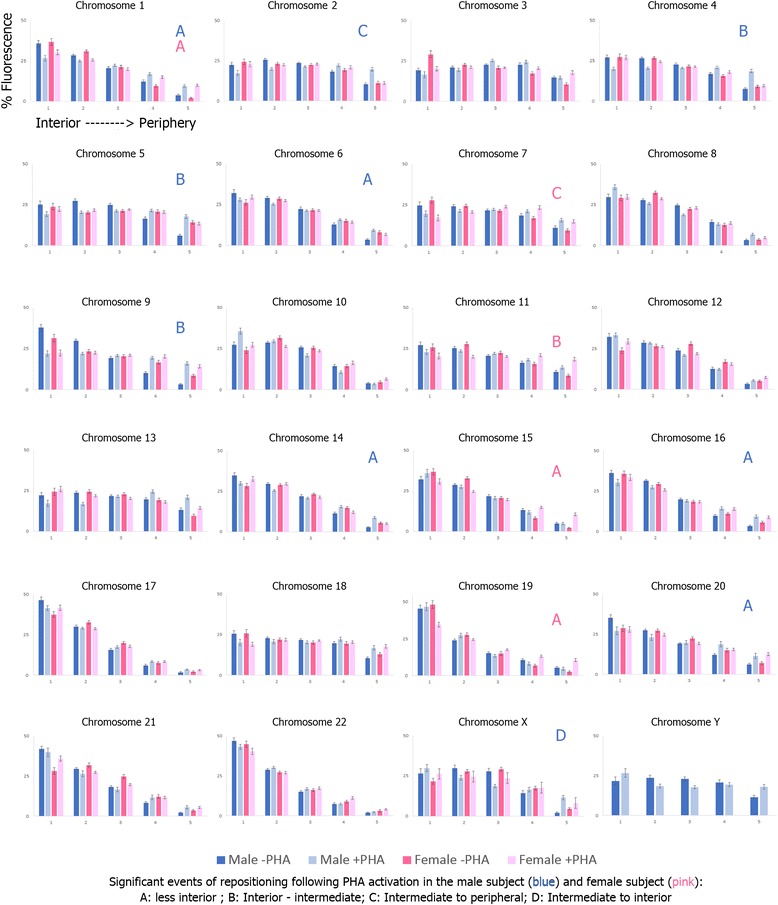
Fig. 1.

Radial organization for all 24 CTs in resting and activated lymphocytes. Displays the radial distribution for all 24 CTs (chromosomes 1–22, X and Y) in both enrolled subjects for resting (-PHA) and activated (+PHA) lymphocytes. The X-axis for all histograms represents each of the five rings of equal area (1–5) moving from the nuclear interior toward the nuclear periphery (left to right). Each ring includes the data for the resting lymphocytes (dark blue and dark pink) and the activated lymphocytes (light blue and light pink) in the male and female subject, respectively. The Y-axis for all histograms represents the proportion of fluorescence (%) for each CT within each of the five rings. Error bars represent the standard error of the mean (SEM). Significant events of repositioning in activated lymphocytes compared to resting are denoted by letters (a–d) in the top right corner of each histogram, blue and pink letters correspond to repositioning events in the male and female subject, respectively. Each letter corresponds to the type or repositioning movement observed based on the radial distribution (see figure key for more details)
