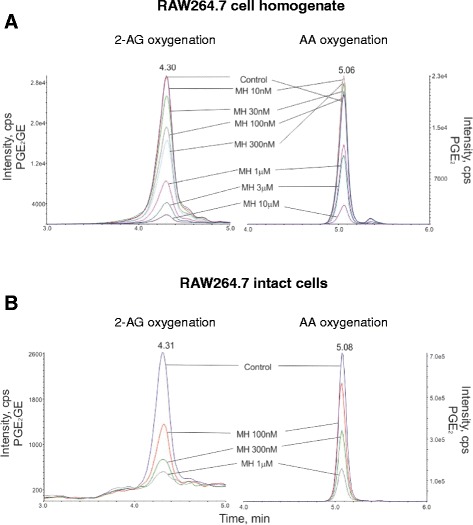
Figure 4.

MS chromatograms of PGE2 and PGE2-GE measured in different biological matrices. Quantification of PGE2 and PGE2-GE formation measured after incubation of (A) RAW264.7 cell homogenate and (B) intact cells with 10 μM of AA or 2-AG in the presence of different concentrations of MH or vehicle. Homogenates and cells were treated for 12 h with LPS (1 mg mL−1) followed by 30-min incubation with 10 μM of 2-AG after the pre-treatment (30 min) with different concentrations of MH or vehicle.
