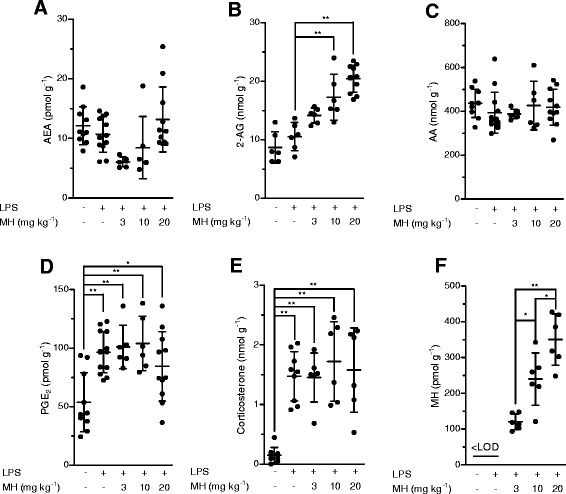
Figure 6.

LC-MS/MS quantification of different analytes in mouse brain. (A) AEA, (B) 2-AG, (C) AA, (D) PGE2, and (E) corticosterone were quantified in the brains from mice (6 to 14 animals per group) challenged for 6 h with LPS (i.p., 2.5 mg kg−1, or saline), after 1 h of pre-treatment with MH (i.p., 3, 10, and 20 mg kg−1) or vehicle. (F) MH quantification in the brain of LPS-challenged mice. * P < 0.05, ** P < 0.01 treated vs. not-treated animals (Figure 6A-E) and * P < 0.05 MH 10 mg kg−1 vs. 20 mg kg−1 (Figure 6F).
