
Figure 2.
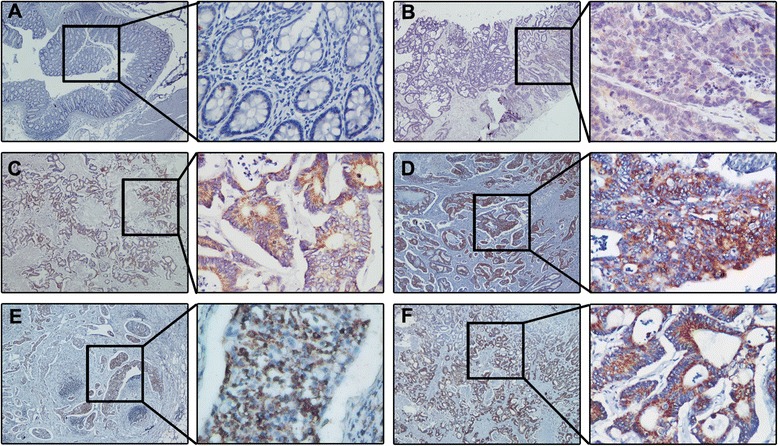
Expression levels of GDH in CRC tissues, metastatic lymph nodes and liver metastases lesions. Representative images of CRC tissues with GDH Negative staining (A), Weak staining: light yellow (B), moderate staining: yellow brown (C), strong staining: brown (D). Representative images of GDH immunostaining in metastatic lymph nodes (E) and liver metastases lesions (F). (Envision × 40, × 400).