Figure 1.

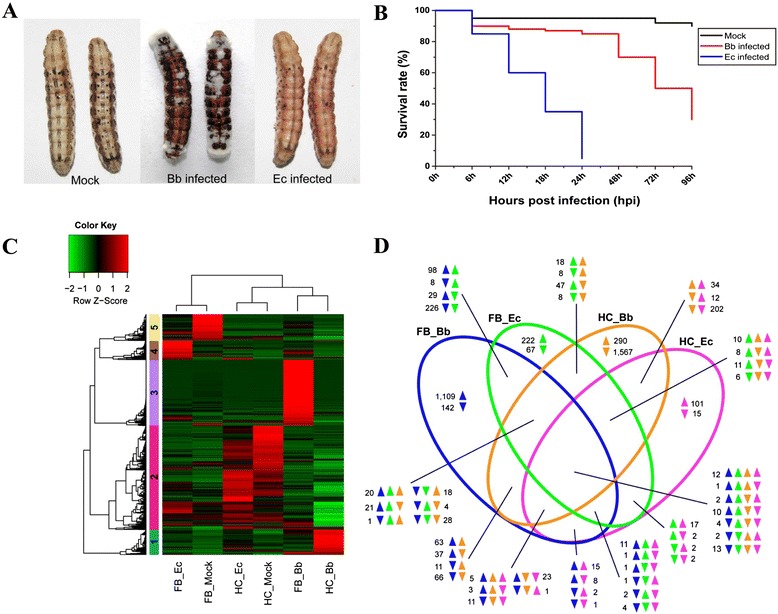
Distinct pathogenicity and transcriptomic change elicited by B. bassiana and E. cloacae. (A) Different phenotypes of the cotton bollworm larvae infected with B. bassiana (Bb) and E. cloacae (Ec). The B. bassiana-infected larvae were covered with white hyphae at 72 h post infection and then became rigid before death. However, E. cloacae-infected larvae turned light red at 12 h post infection and became gradually liquefied before death. (B) Survival curves of H. armigera larvae infected by Bb (red line) and Ec (blue line) in comparison with the control group (black line). Three repeats, p < 0.01. (C) Hierarchical clustering analysis of DETs in fat bodies and hemocytes of H. armigera larvae infected by Bb 48 h post infection and Ec 6 h post infection, respectively. The transcript levels significantly (p < 0.001) increased (>2 fold) and decreased (<0.5 fold) under at least two experimental conditions. The heatmap is divided into five discrete clusters and color coded on the left. Cluster 1 (cyan, induced) and Cluster 2 (magenta, suppressed) in hemocytes from Bb infected larvae; cluster 3 (purple) and 4 (brown) induced in fat body of Bb and Ec infected larvae, respectively; cluster 5 (yellow) genes suppressed in fat body of Bb and Ec infected larvae. FB_Mock, control fat body; FB_Bb, fungus-induced fat body; FB_Ec, bacterium-induced fat body; HC_Mock, control hemocytes; HC_Bb, fungus-induced hemocytes; HC_Ec, bacterium-induced hemocytes. (D) A Venn diagram showing the shared and unique DETs in fat body and hemocytes, induced by the fungal and bacterial infection. The overlapping regions represent genes that are concomitantly regulated in two, three or four samples. The directions of transcript level changes are indicated by upward- and downward-pointing arrows. Blue, green, brown and purple represent Bb-fat body, Ec-fat body, Bb-hemocytes, and Ec-hemocytes, respectively.
