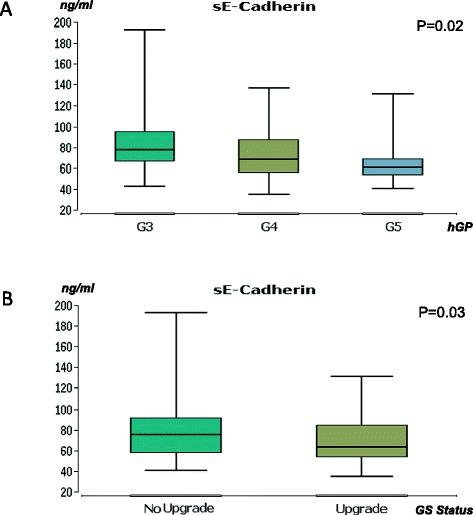
Fig. 2.

Associations between sE-cadherin and histopathological parameters. a: Association between sE-cadherin expression and highest Gleason pattern. Y-axis - concentration in ng/ml; X-axis - serum samples of tumor patients distributed by the highest Gleason pattern (hGP). G3-G5 - Gleason pattern 3-5. P-value (Kruskal-Wallis-test). b: Association between sE-cadherin expression and Gleason sum upgrade. Y-axis - concentration in ng/ml; X-axis - serum samples of tumor patients distributed by upgrade status of the Gleason sum in prostatectomy specimen. P-value (Wilcoxon-Mann–Whitney-test). Box: lower line - quartile Q1 (25 %-quantile); middle line - median; upper line - quartile Q3 (75 %-quantile); aerials - extreme values
