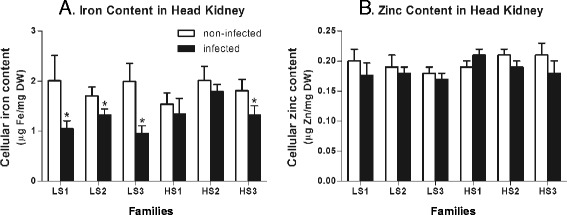
Fig. 4.

Cellular iron and zinc content in infected and non-infected fish from LS and HS families. a Cellular content of iron (μg) in dry weight (DW) head kidneys (mg) from non-infected (white bars) and infected tissues (black bars). b Cellular content of zinc (μg) in dry weight (DW) head kidneys (mg) from non-infected (white bars) and infected tissues (black bars). In all case, bars represent the mean of five biological replicate determinations (± SEM); *, p < 0.05 (Student’s t test)
