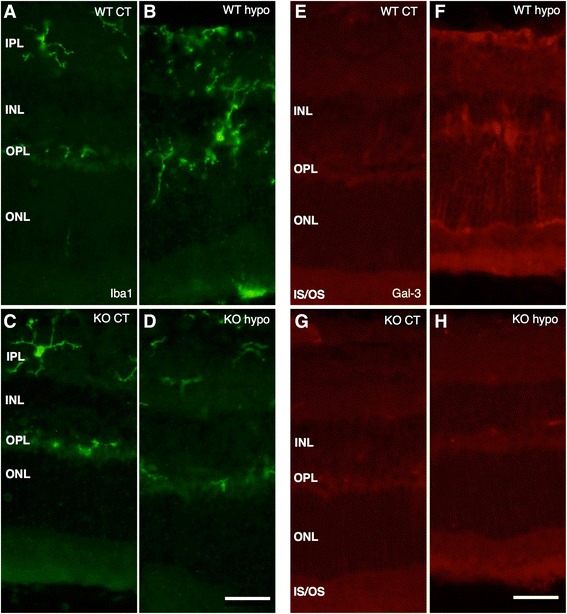
Figure 8.

Immunohistochemical labeling of microglia and Gal3 expression. (A-D) Iba1. (E-H) Gal3. (A) Iba1-labeled WT control mice show scattered, ramified microglia present in the plexiform layers. (B) Hypoperfused WT animals display numerous microglia of both ramified and amobeoid morphology present throughout the retina, with isolated amobeoid cells in the outermost layers. (C) KO control retinas display ramified microglial cells in the plexiform layers. (D) A similar labeling pattern and cell morphology is seen in KO hypo mice. (E) WT control animals show no Gal-3 labeling. (F) Hypoperfused WT retinas show striated labeling spanning all nuclear layers with strongly labeled scattered structures in the inner layers. (G) KO control animals reveal no labeling of Gal-3. (H) Hypoperfused KO mice display no labeling of Gal-3. Scale bars = 50 μm.
