
Fig. 1.
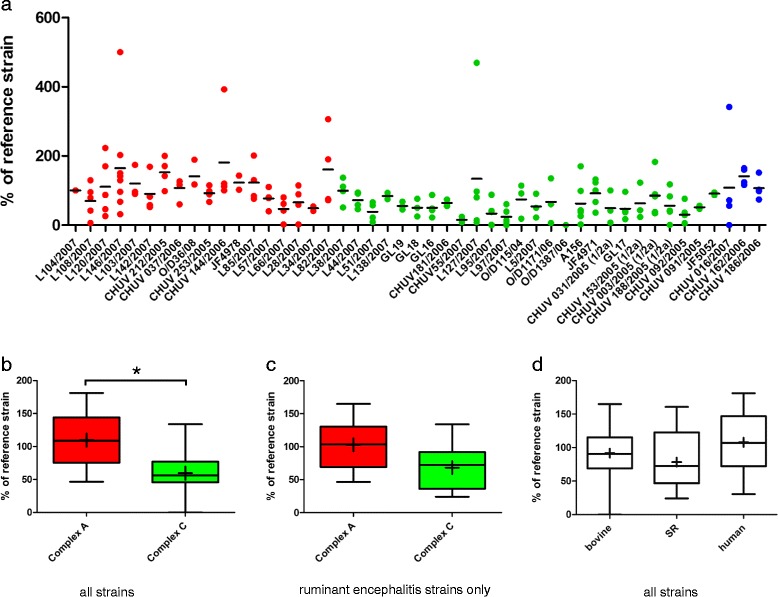
Replication of L. monocytogenes strains in brain-slices. Results are shown relative to the internal control strain L104. a Aligned dot plot of the relative CFU counts of the individual strains. Red: MLVA complex A; green: MLVA complex C; blue: MLVA complex B. The horizontal line indicates the mean. b Box plot comparing relative CFU counts between complex A and C strains. CFU counts are significantly higher in brain-slices infected with complex A strains, * = p < 0.05. c Box plot comparing relative CFU counts between complex A and C strains isolated from ruminant rhombencephalitis. d Box plot comparing relative CFU counts according to host species. Whiskers represent maxima and minima. The horizontal line represents the median, + is the mean