
Fig. 5.
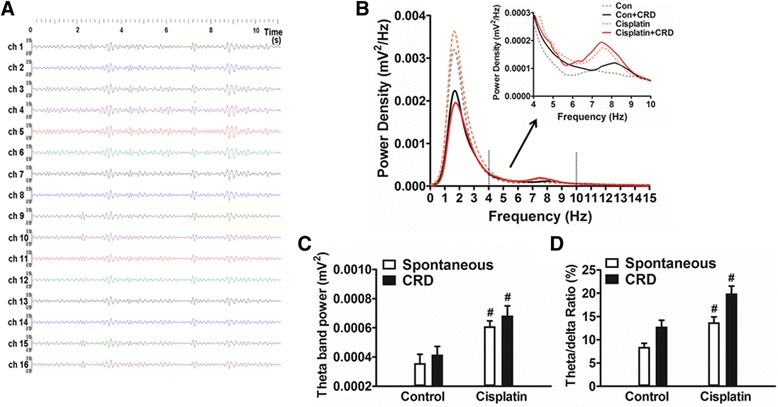
Enhanced the power of ACC theta-band oscillation (4–10 Hz) in cisplatin-treated rats. a The 16 channels LFP oscillations in the theta band frequencies recorded from the ACC. b The averaged power spectral density (PSD) showing a wider band of frequencies (0–15 Hz) in control and cisplatin-treated rats during spontaneous and CRD conditions. The main peaks of the PSD located during 1–4 Hz (delta band), the second peaks as magnified in the inset show power distributions in the 4–10 Hz (theta band) in different groups. c The average AUC of theta band PSD in control and cisplatin-treated rats showing increases in theta-band oscillation (4–10 Hz) power during both spontaneous and CRD stimulate conditions in cisplatin rats. d The histogram shows the enhancement of theta/delta ratio (theta/(theta + delta) in cisplatin rats. Data are expressed as mean ± SEM. # p < 0.05 vs. control