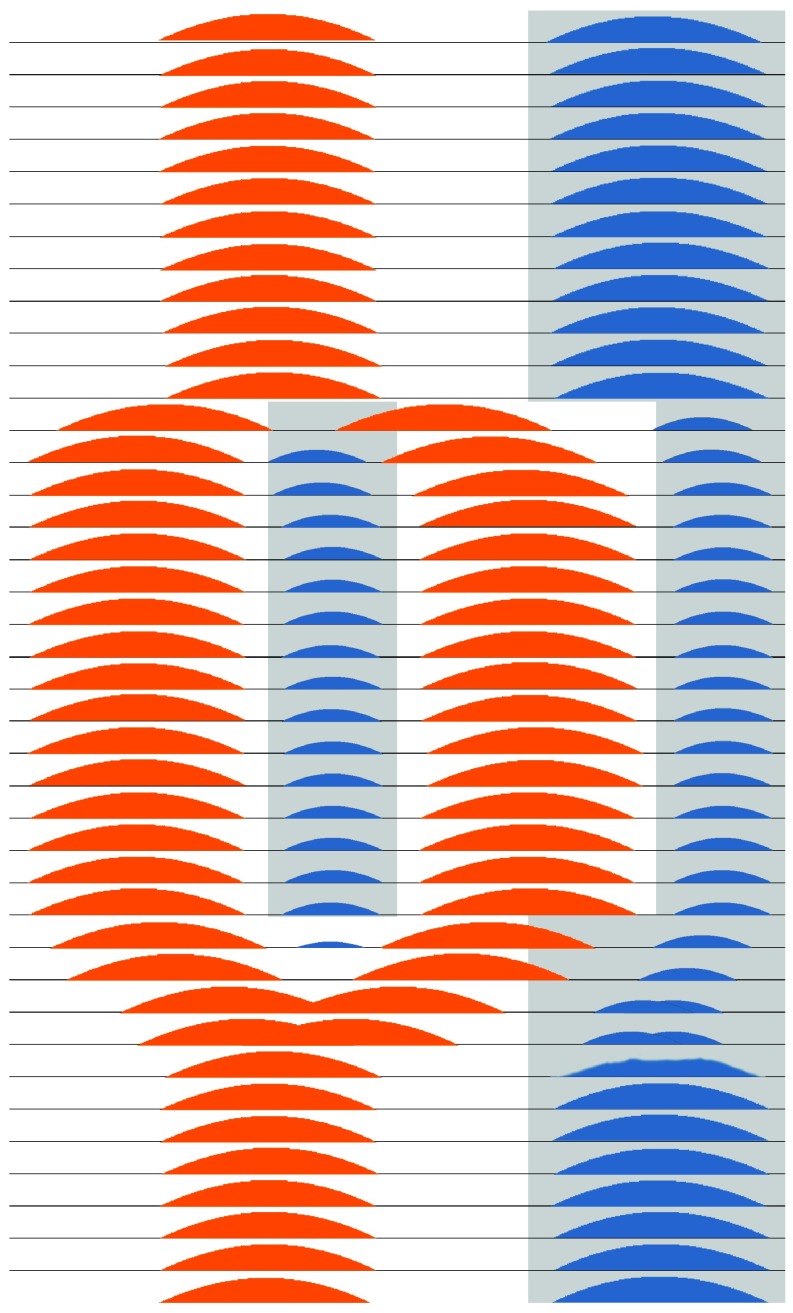
Figure 2. Theoretical schematic of circadian bifurcation in humans.
In this diagram, each line of the ordinate represents a 24-hour day and the abscissa represents the 24 hours within that day. The grey shading depicts very dim light or darkness, whereas the white background represents daylight and artificial light. The light-dark cycle is modelled as commencing with LD16:8 and transitioning in the middle days to LDLD8:4:8:4, with return to LD16:8 in the final days. The orange shading represents SCN multiunit neuronal firing that gradually splits apart and bifurcates into two antiphase patterns of firing during LDLD8:4:8:4, representing two distinct populations of coupled SCN neurons. During LD16:8, firing might be spread out over a longer interval in the light than is shown, but there may be insufficient data to model the pattern of neuronal timing more exactly. After return to LD16:8 or to continuous darkness (DD), the two components of neuronal firing gradually fuse together again. The blue regions represent melatonin secretion during the dark intervals. Suppressed by neuronal firing and light suppression, it is plausible that melatonin secretion would be partly or completely inhibited during the transitions from LD16:8 to LDLD8:4:8:4 and back again, during which melatonin secretion would bifurcate and then fuse again. These patterns are theoretical, because the transitions of neuronal firing and melatonin secretion from an LD pattern to a bifurcating LDLD pattern and back again have never been observed simultaneously in detail, certainly not in a diurnal mammal.

