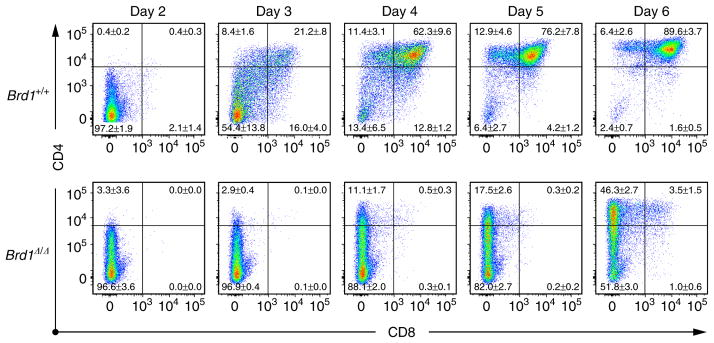
Figure 4. In vitro differentiation of Brd1Δ/Δ DN3 cells.

DN3 cells from Tie2-Cre control (Brd1 +/+) and Tie2-Cre;Brd1fl/fl (Brd1Δ/Δ) mice were seeded on TSt-4/DLL stromal cells in triplicate and their differentiation was monitored. Cytokines (10 ng ml −1 SCF, IL-7 and Flt3L) were supplemented only for the initial 24 h. Representative CD4 and CD8 expression profiles from the three repeated experiments are depicted. The proportion of each gate is indicated.
