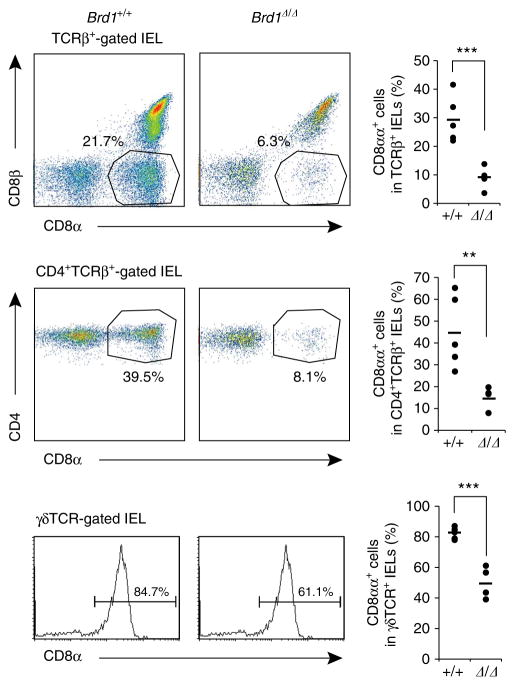
Figure 5. Impaired CD8 expression in IEL subsets in the absence of Brd1.
Expression of CD8αα in TCRβ+, CD4 +TCRβ+ and γδTCR + IELs was analysed in Tie2-Cre control (Brd1 +/+) and Tie2-Cre;Brd1fl/fl (Brd1Δ/Δ) mice. Representative flow cytometric profiles from the two repeated experiments with a proportion of each gate (left panels) and the percentages of CD8αα+ cells in the indicated cell populations with mean values (right panels) are shown. **P<0.01 and ***P<0.001 (Student’s t-test).

