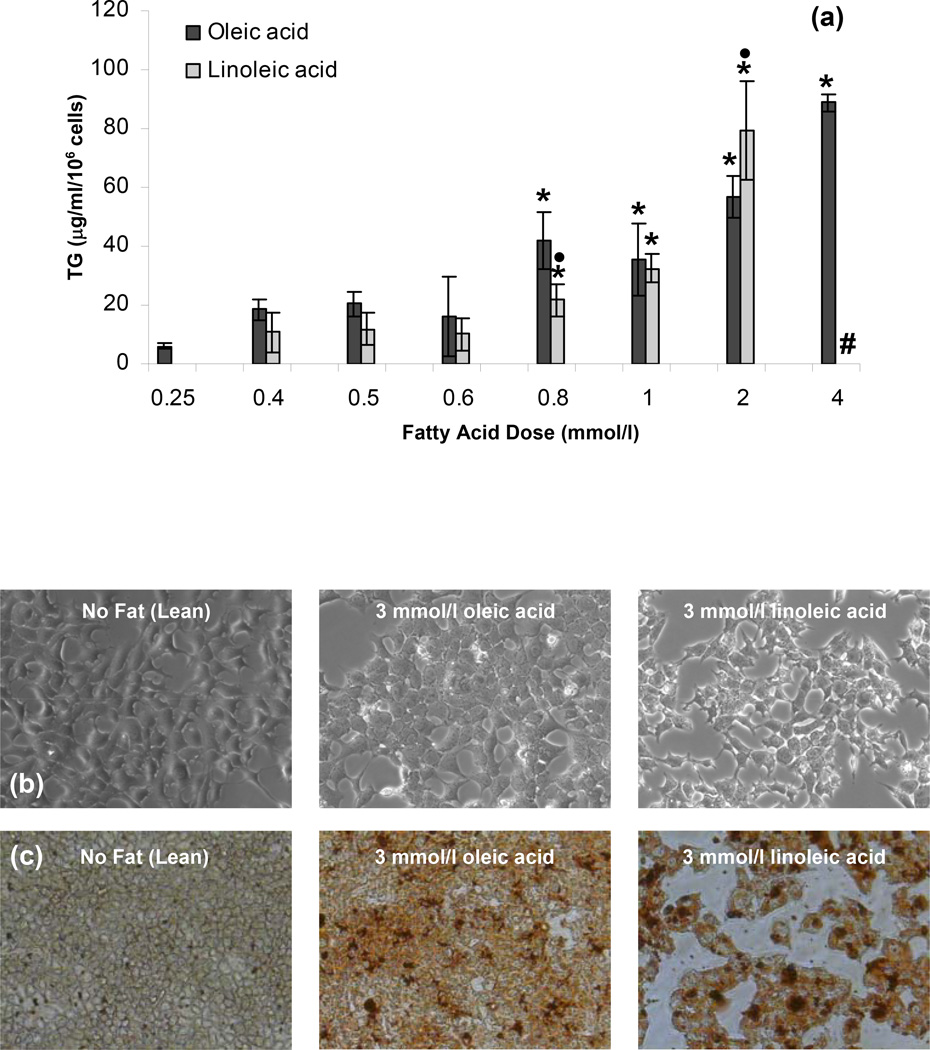
Figure 1.
Intracellular TG accumulation in H35 cells as a function of fatty acid dose (a) measured by TG assay, (b) optical microscopy, and (c) Oil-Red-O staining. All measurements were performed after the H35 cells were exposed to different FFA doses for 72 h. Error bars represent 95% confidence intervals. * p ≤ 0.05 compared to values for 0.25 mmol/l fatty acid dose. • p ≤ 0.05 compared to values for same OA dose. # cells treated with 4 mmol/l LA did not survive over the 72 h culture period.

