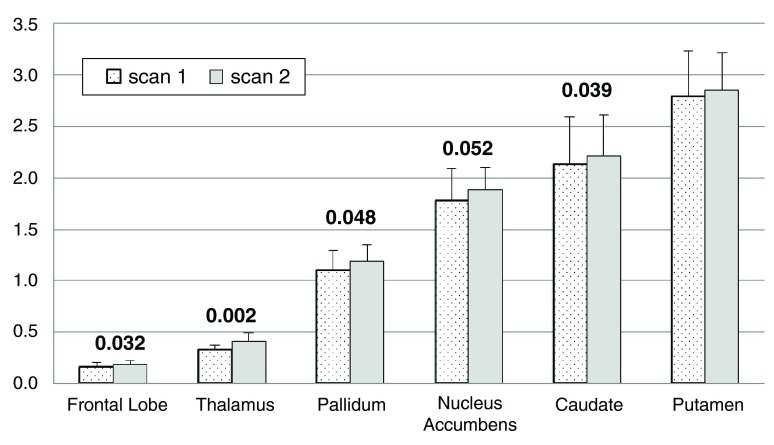
Figure 5. Change in BP ND on the placebo day.
For each of the a priori VOIs, mean BP ND across all 10 subjects is shown before and during the infusion on the placebo day only. Error bars show SD. Numeric labels are p values for the main effect of time in the individual region ANOVAs (putamen p=.115).

