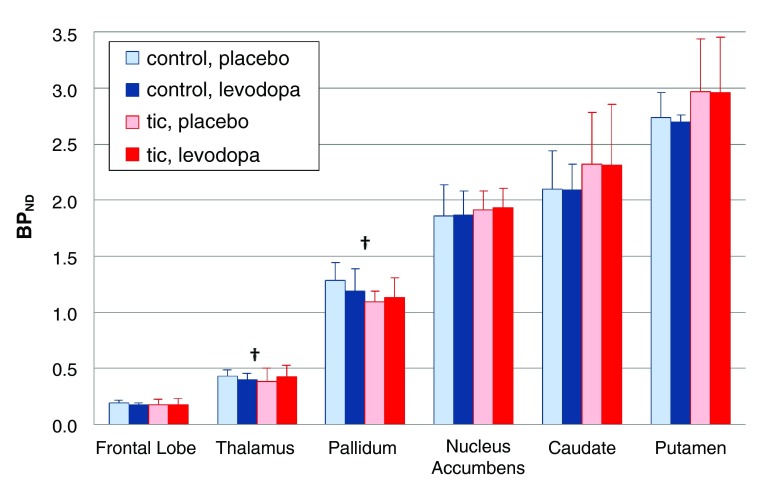
Figure 7. Levodopa-induced change in BP ND, by diagnosis.
Mean BP ND for the a priori VOIs is shown during the levodopa and placebo infusions; the error bar indicates SD. The day × time × diagnosis interaction and the day × time × diagnosis × region interaction were not significant. The daggers indicate a trend in the thalamic and pallidal VOIs for BP ND to decrease with levodopa in the control group but increase with levodopa in the tic group (regional ANOVA, day × time × diagnosis interaction, pallidum p=0.050, thalamus p=0.098).

