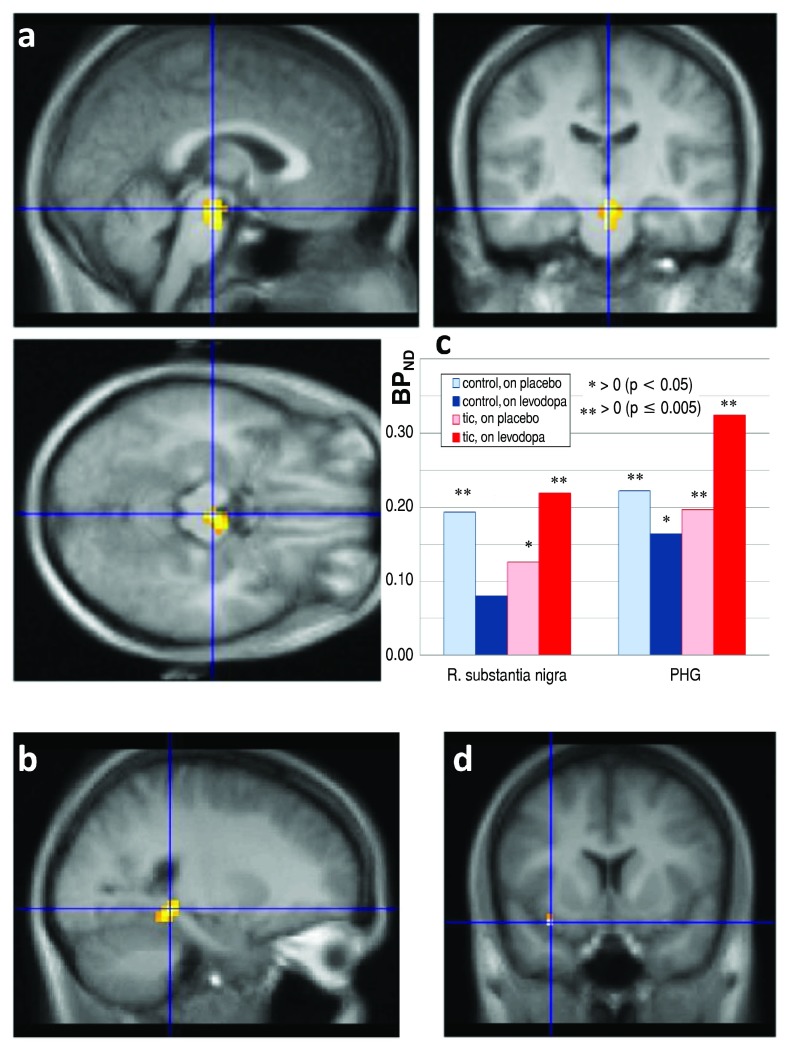
Figure 8. RAC* binding on levodopa vs. placebo, by diagnosis.
Differences in the RAC* binding response to levodopa between TS and control subjects, thresholded at uncorrected p = 0.001, in color, laid over the MRI template image in grayscale. a, b: Significant clusters, with blue lines crossing at the peak t value in midbrain ( a, three views) and in parahippocampal gyrus ( b). A third statistically significant cluster was centered at the posterior edge of the occipital lobe, but both the location and the observation that in this cluster the BP ND on placebo was negative in half the subjects suggests that this cluster likely does not reflect specific binding. c: Levodopa-induced change in BP ND, TS vs. control, in the clusters shown in A and B. R., Right; PHG, parahippocampal gyrus. Asterisks indicate that mean BP ND differs significantly from zero. d: The blue lines cross at the voxel with the highest t value in the whole-brain SPM analysis of levodopa effect ΔDVR images ( t=11.62, 8 df).

