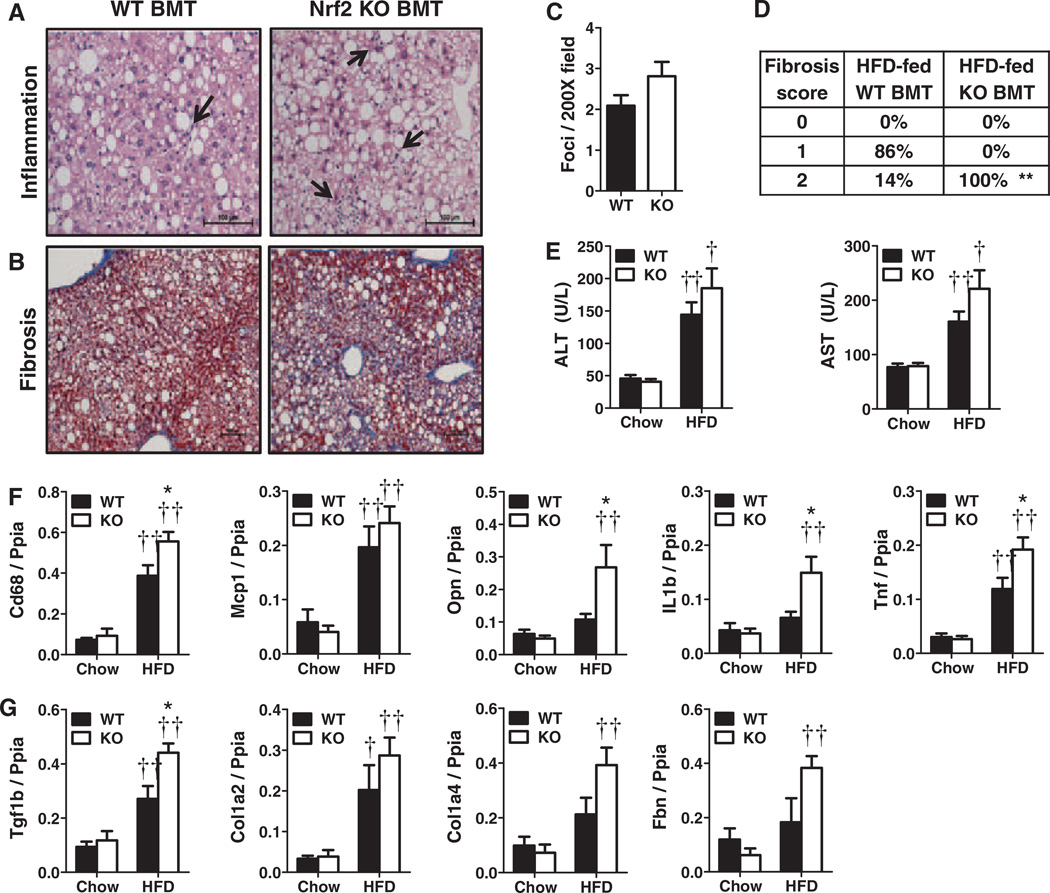
Figure 4.
(Nrf2−/−) bone marrow transplant (BMT) increases inflammation and fibrosis in liver. Representative histology of (A) inflammatory foci (arrows), and (B) fibrosis. C, Inflammatory foci per ×200 field (n=3–7/group); (D) hepatic fibrosis scores (n=4–7/group); (E) plasma alanine aminotransferase (ALT) and aspartate aminotransferase (AST); Hepatic (F) proinflammatory and (G) fibrotic gene expression. (Mean±SEM, n=4–8/group; *P<0.05, **P<0.01 vs. WT for matched diet, †P<0.05, ††P<0.01 vs. chow for matched genotype). KO indicates knockout; HFD, high-fat diet; IL, interleukin; Tnf, tumor necrosis factor; Tgf1b, transforming growth factor.

