Figure 4.

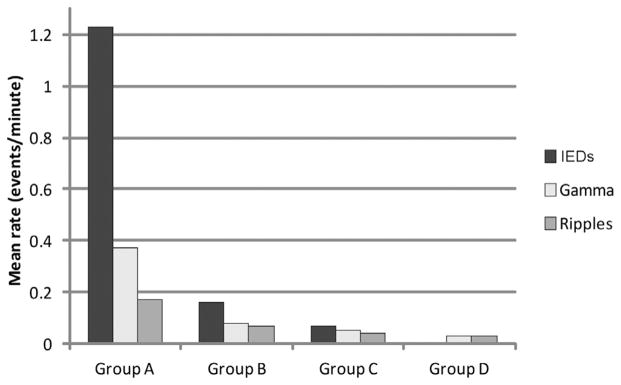
Graphs showing the rates of IEDs, gamma and ripples in the four groups separately. Group A, with frequent IEDs (>1/min), also shows higher rates of fast oscillations (p < 0.001). Mean rates across channels are reported.

Graphs showing the rates of IEDs, gamma and ripples in the four groups separately. Group A, with frequent IEDs (>1/min), also shows higher rates of fast oscillations (p < 0.001). Mean rates across channels are reported.