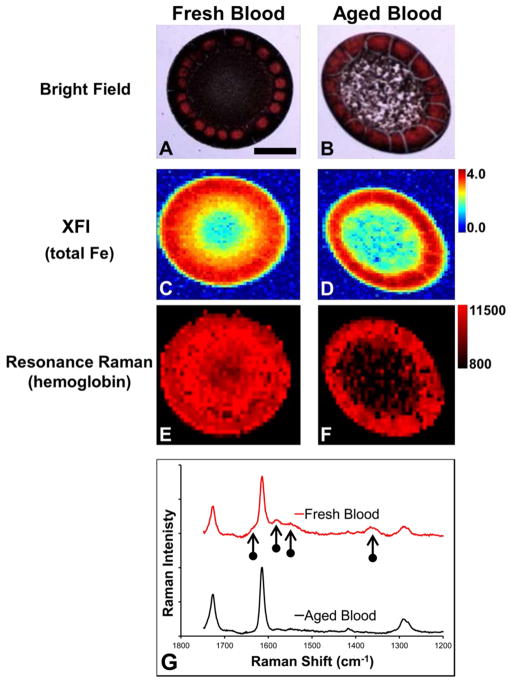
Figure 1.
Resonance Raman and XFI analysis of fresh and aged blood from the proof-of-principle experiment. (A, B) Bright-field visible light images of dried drops of blood prepared from (A) fresh blood and (B) dried blood. (C, D) XFI images of total Fe in dried drops of blood prepared from (C) fresh blood and (D) aged blood. (E, F) Resonance Raman images of hemoglobin distribution in dried drops of blood prepared from (E) fresh blood and (F) aged blood. (G) Representative resonance Raman spectra (514 nm excitation) collected from fresh and aged blood. The intensity scale for panels C and D is in μg cm−2. The intensity scale for panels E and F is integrated Raman counts (AU). Vertical arrows indicate characteristic resonance Raman heme bands. Scale bar = 500 μm.

