
Figure 4.
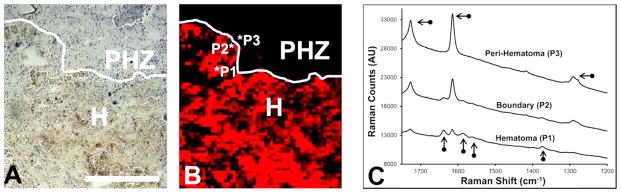
Representative resonance Raman spectra. (A) Cresyl violet histology showing the hematoma (H) and peri-hematoma zone (PHZ). (B) Enlarged resonance Raman map from Figure 3F. (C) Resonance Raman spectra extracted from positions that correspond to the hematoma (P1), hematoma/peri-hematoma boundary (P2), and peri-hematoma (P3). Vertical arrows indicate characteristic resonance Raman heme bands. Horizontal arrows indicate bands from the plastic thermanox substrate. Scale bar = 500 μm.