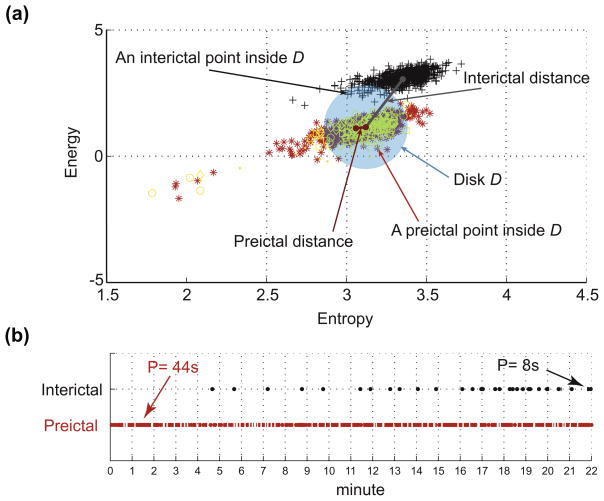
Fig. A1.
Illustration of the distance, inclusion and persistence features in the energy and entropy space. (a) Energy and entropy profiles of a 22 min window of an interictal epoch (black symbols) and a preictal epoch (red symbols) are at different distances from the center (mean point of 90 s immediate preictal energy and entropy profile shown in yellow symbols) of the disk D, calculated from a separate set of preictal epochs. Any point inside the disk D counts for the inclusion rate of the distribution. (b) Temporal distribution of the amount of time spent inside the disk D in the same preictal (red dots) and interictal (black dots) energy and entropy profiles shown in (a). The dots indicate points inside the disk (each point represents 2 s duration). The persistence is the period of time corresponding to the maximum number of temporally contiguous points in the disk D. In this example preictal persistence is 22 pts. × 2 s = 44 s and interictal persistence is 4 pts. × 2 s = 8 s. Reproduced with Permission from: Gadhoumi K, Lina JM, Gotman J. Discriminating preictal and interictal states in patients with temporal lobe epilepsy using wavelet analysis of intracerebral EEG. Clin Neurophysiol 2012;123:1906–1916.

