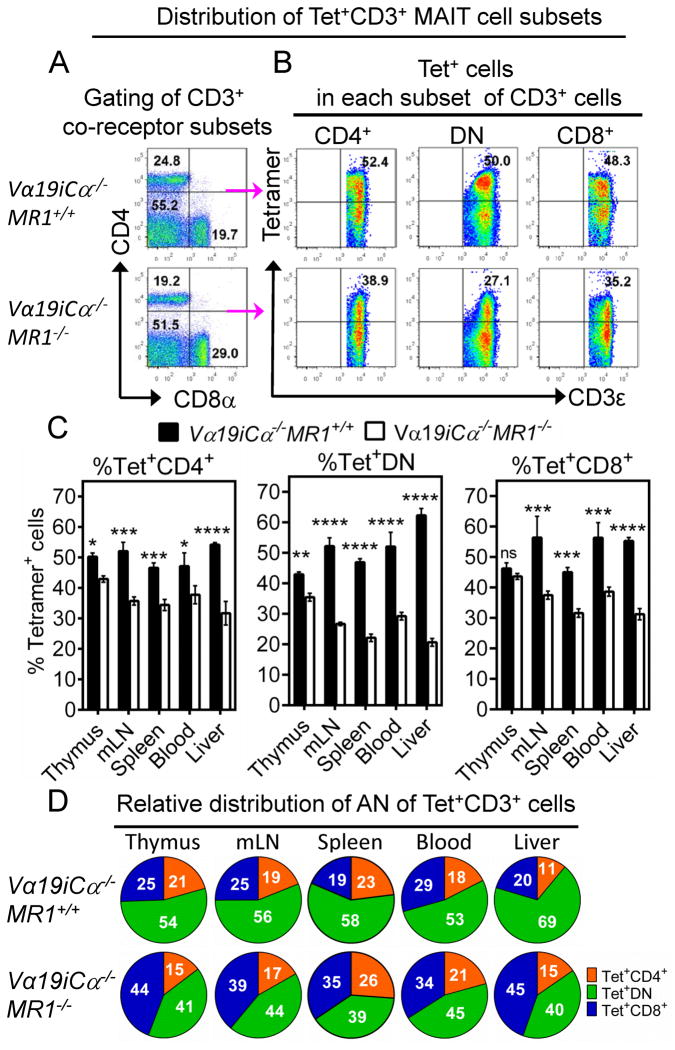
FIGURE 2.
Frequency of CD3+ tetramer+ MAIT cell subsets in the thymus (CD3high thymocytes), mLN, spleen, blood and liver in Vα19iCα−/−MR1+/+ or Vα19iCα−/−MR1−/− mice. (A) Representative FACS plots of CD4 vs. CD8α gated on CD3+ lymphocyte population for CD4−CD8− (DN), CD4+CD8− and CD4−CD8+ co-receptor CD3+ subsets in the spleen of Vα19iCα−/−MR1+/+ or Vα19iCα−/−MR1−/− mice. (B) Staining of tetramer+ cells among CD4+ (left plots), DN (centre plots) or CD8+ (right plots) CD3+ splenocytes from Vα19iTgMR1+/+ (top panels) or Vα19iCα−/−MR1−/− (bottom panels) mice. (C) Percentages of tetramer+ CD4+ T cells (left panel), tetramer+ DN T cells (middle panel) and tetramer+ CD8+ T cells (right panel) in the indicated tissues are shown. (D) Pie charts comparing the relative distribution of absolute numbers of tetramer+ CD3+ T cell subsets in the indicated tissues of Vα19iCα−/−MR1+/+ (top panel) or Vα19iCα−/−MR1−/− (bottom panel) mice. Data shown are from more than three separate experiments. P values (obtained using Mann-Whitney U-test and 2way ANOVA (multiple comparison test)) denote comparison of mean differences ± SEM of % tetramer+ cells between Vα19iCα−/−MR1+/+ and Vα19iCα−/−MR1−/− mice. *p<0.05; **p<0.01 and ***p<0.001, ****p<0.0001.

